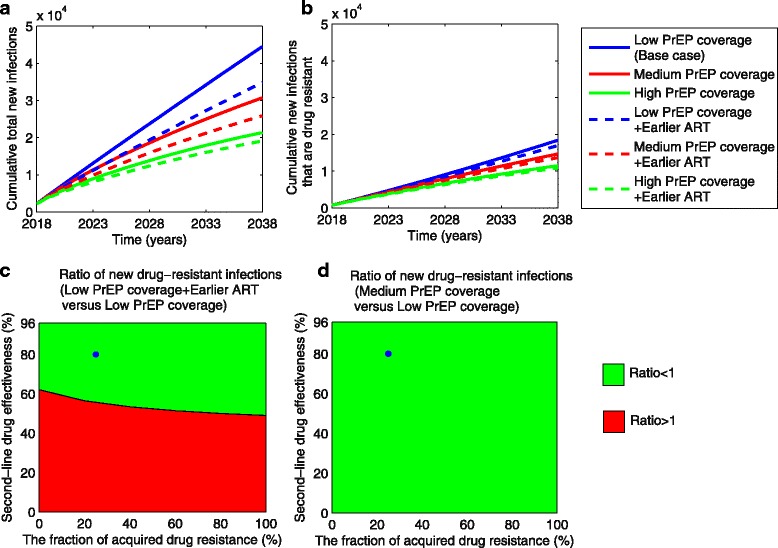
Fig. 3.

The cumulative total incidence (a) and drug-resistant incidence (b) from 2018 to 2038 for different combinations of PrEP coverage and ART initiation time (as shown in Fig. 1b). The ratios of cumulative drug-resistant incidence over 20 years for low PrEP coverage plus earlier ART versus the status quo (c), and for medium PrEP coverage versus the status quo (d), respectively, where we consider the status quo as the low PrEP coverage scenario. The green and red areas in c indicate parameter combinations in which adding earlier ART to the status quo would decrease and increase the incidence of drug resistance, respectively. The drug-resistant incidence always decreases for medium PrEP coverage across all range of second-line drug effectiveness as shown in green area in d. The blue circles in c and d denote the base cases (the second-line drug effectiveness is 80% and 25% of treated cases have acquired drug resistance, and all of them switch to second-line drugs timely). All other parameters are fixed as shown in Additional file 1: Table S1. PrEP pre-exposure prophylaxis, ART antiretroviral therapy
