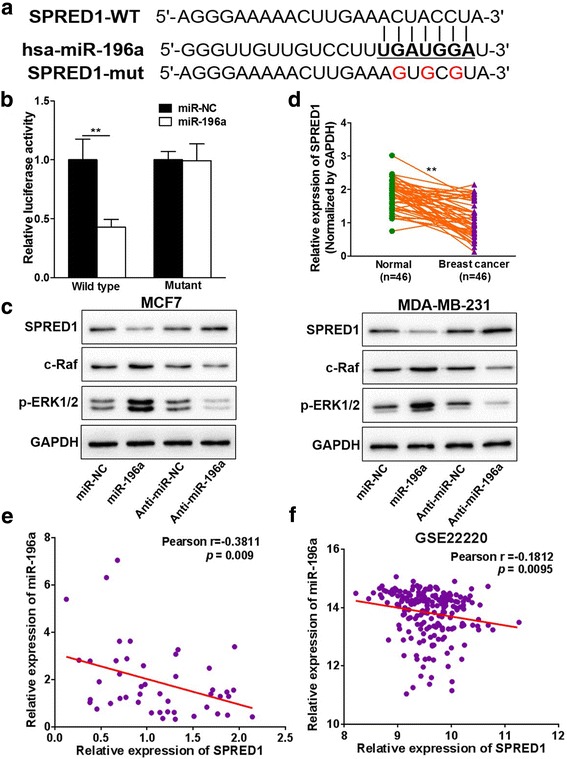
Fig. 5.

MiR-196a directly targets and inhibits SPRED1. a Putative seed-matching sites (in bold) or mutant sites (red) between miR-196a and 3’-UTR of SPRED1 were analyzed by TargetScan, miRWalk 2.0 and miRBase. b The wild type (WT) and mutant (mut) SPRED1 3′-UTR reporter constructs were made and verified by sequencing. Luciferase reporter assay was performed using 293 T cells to detect the relative luciferase activities of WT and mut SPRED1 reporters. Renilla luciferase vector was used as an internal control. Data were presented as the means ± SD from three independent experiments with quadruple replicates per experiment. ** indicates significant difference compared to the control at P < 0.01. c Protein expression levels of SPRED1, c-Raf, pERK1/2 and GAPDH were determined using Western blot analysis in MCF7 and MDA-MB-231 cells overexpressing miR-196a, miR-NC or anti-miR-196a inhibitor and anti-miR-NC. d The expression levels of SPRED1 in adjacent normal tissues and human BC specimens were determined by qRT-PCR, and the fold changes were obtained by the ratio of SPRED1 to GAPDH levels. ** indicates significant difference compared to the normal tissues P < 0.01. e Pearson’s correlation analysis was used to determine the correlation between the expression levels of SRED1 and miR-196a in human BC specimens (n = 46). f GEO dataset GSE22220 was used to analyze the Pearson’s correlation between miR-196a and SPRED1 levels
