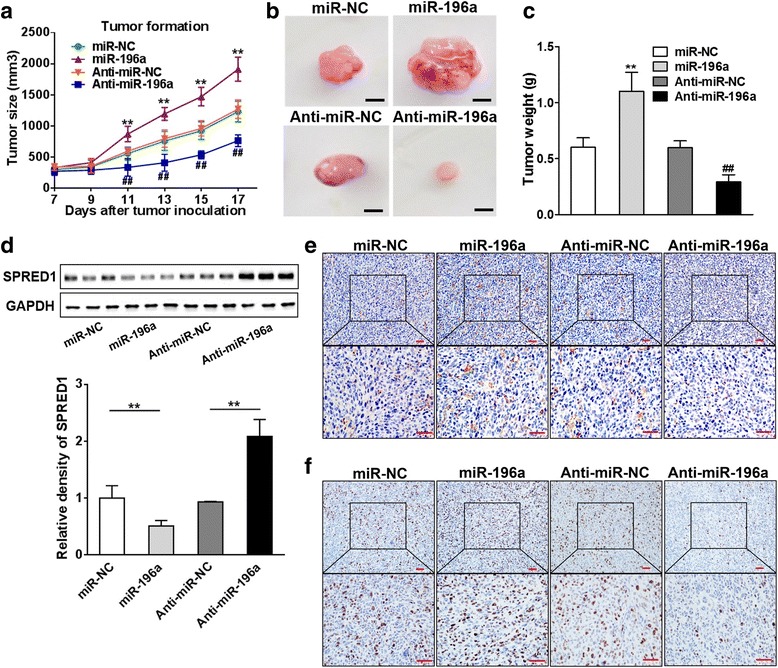
Fig. 7.

MiR-196a induces tumor growth in vivo. a MCF7/miR-196a, MCF7/miR-NC, MCF7/anti-miR-196a, or MCF7/anti-miR-NC cells (5 × 10⁶cells) were dispersed in 100 μl of serum-free DMEM medium and subcutaneously injected into the both sides of posterior flank of female nude mice (n = 8). Tumors growth was measured every two days after the tumors were detected in 7 days and the tumor volumes were calculated using the following formula: volume = 0.5 × Length × Width2. ** indicates significant difference compared to miR-NC group at P < 0.01; ## indicates significant difference compared to anti-miR-NC group at P < 0.01. b The representative pictures of trimmed tumors (Bar = 10 mm). c The tumors were excised and weighed after 17 days. Data were presented as the means± SD from all tumors. ** indicates significant difference compared to miR-NC group at P < 0.01. ## indicates significant difference compared to Anti-miR-NC group at P < 0.01. d The total proteins were extracted from xenografts and subjected to Western blot analysis for SPRED1 expression. GAPDH expression level was served as an internal control. e, f The expression of CD31 and Ki67 were analyzed in tumor tissues by immunohistochemistry (bar = 50 μm). ** indicates significant difference compared to the miR-NC group at P < 0.01; ## indicates significant difference compared to the anti-miR-NC group at P < 0.01
