Fig. 1.

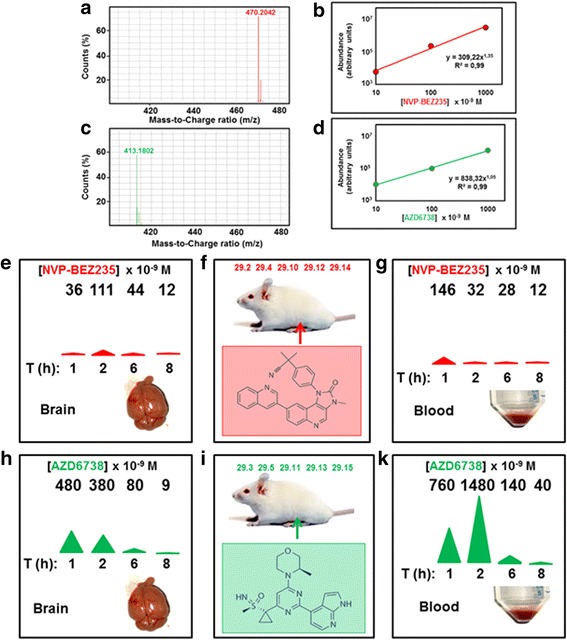
Pharmacokinetics of ATRi studied by HPLC/MS in positive polarity. a Isotopic pattern of NVP-BEZ235. b Relationship between HPLC/MS-determined abundance and concentration of NVP-BEZ235. The limit of quantitation (LoQ) was 10 × 10− 9 M. c Isotopic pattern of AZD6738. d Relationship between HPLC/MS-determined abundance and concentration of AZD6738. The limit of quantitation (LoQ) was 10 × 10− 9 M. e-g BBB crossing by NVP-BEZ235. Tumor-free mice were inoculated i.p. with 25 mg/Kg body weight of NVP-BEZ235 (f). At the indicated times [T (h)] blood was withdrawn retroorbitally for plasma isolation and analysis (g). Mice were then euthanized and the brains explanted (e). All blood and brain samples were then resuspended in water/methanol, homogenized, centrifuged and the supernatant determined for its NVP-BEZ235 concentration using HPLC/MS as described under Methods and Materials. Concentration values (× 10− 9 M) are shown at the top of (e) and (g) and illustrated at half-panel by the area of a colored triangle. S.D. of values determined by this procedure is on average ± 31%. Mouse ID numbers are shown at the top of F for the sake of reference. h-k As in E-G but with AZD6738
