Fig. 6.

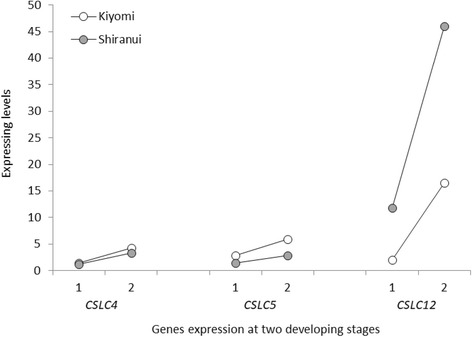
CSLC transcript expression levels in ‘Kiyomi’ and ‘Shiranui’ at two developmental stages. 1: at the first stage; 2: at the second stage. CSLC genes on the X-axis are listed in the order of the average expression levels from highest to lowest

CSLC transcript expression levels in ‘Kiyomi’ and ‘Shiranui’ at two developmental stages. 1: at the first stage; 2: at the second stage. CSLC genes on the X-axis are listed in the order of the average expression levels from highest to lowest