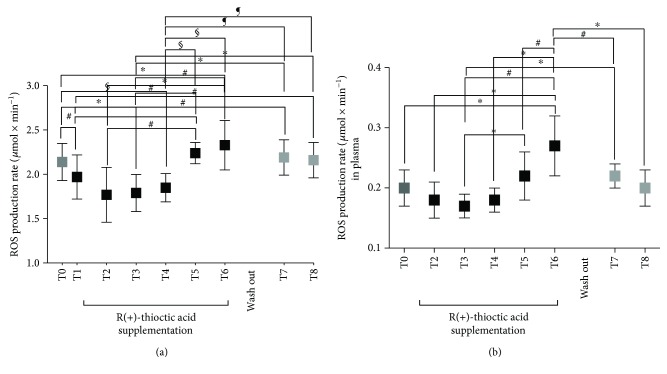
Figure 2.
Time course of the ROS production rate (μmol·min−1) in capillary blood (a) and plasma (b) calculated by the EPR-recorded spectra at the protocol times (T0–T8). Data are expressed as mean ± SD. Times without supplementation (T0, T7, and T8—grey full squares); times following antioxidant (R(+)-thioctic acid) supplementation (black full squares). ∗P < 0.05, #P < 0.01, and §P < 0.001, significant differences. ¶P < 0.0001.

