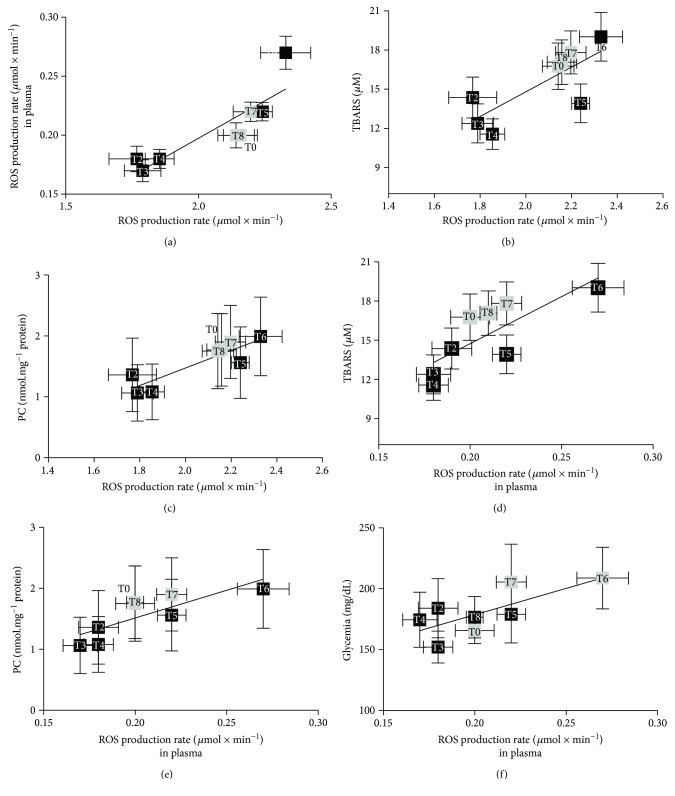
Figure 7.
Panel plots (for better graphical visualization, the data are reported as mean ± standard error of mean (SEM)) of the ROS production rate data in capillary blood (a, b, c) and plasma (d, e, f) versus the biomarkers of oxidative damage (TBARS and PC) and the glycaemic values. The linear regression lines are reported in each panel showing very strong correlation between the EPR data and the other variables (see text). The time of the measurement (as T0–T8) is reported inside each data point.

