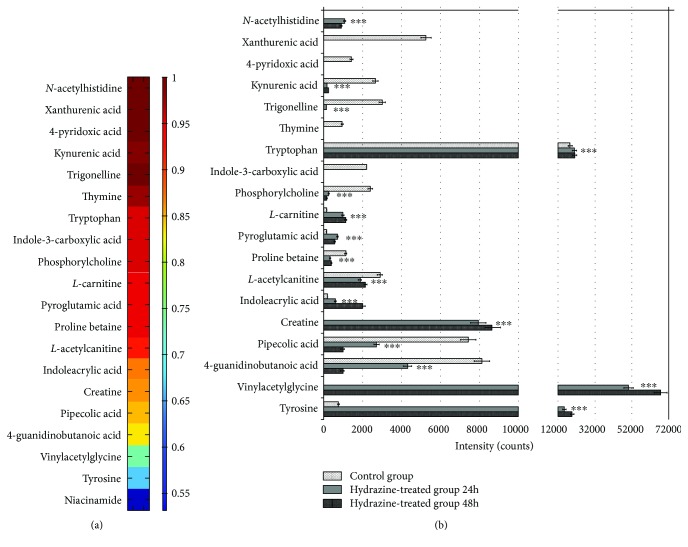
Figure 5.
(a) Visualization of the discriminatory powers of individual potential biomarkers (AUC values > 0.8). Heat map showing the discriminatory capacity of each metabolite estimated by the AUC. Colors correspond to AUC values; red and blue represent high and low values, respectively. (b) Concentration changes of potential biomarkers in the control and liver-injured groups (∗∗∗ p < 0.001).

