Figure 6.

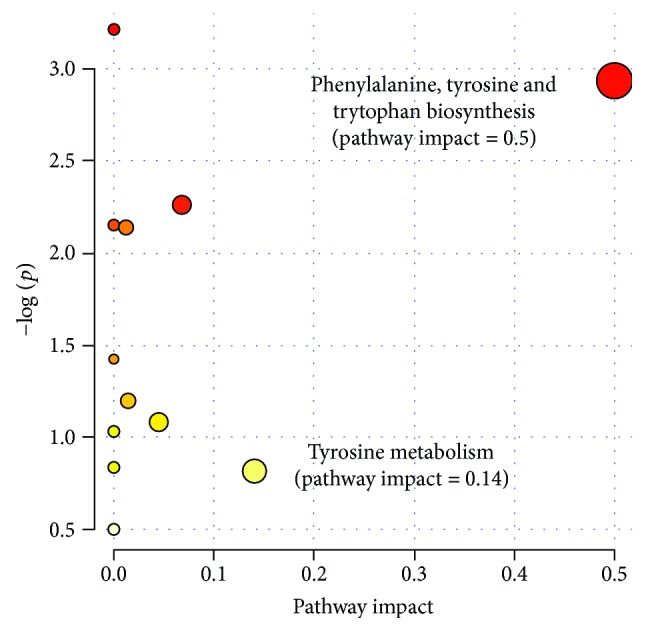
Metabolic pathway analysis for potential biomarkers related to liver-injured rats induced by hydrazine. The most relevant pathways are represented by large and dark nodes (pathway impact > 0.1).

Metabolic pathway analysis for potential biomarkers related to liver-injured rats induced by hydrazine. The most relevant pathways are represented by large and dark nodes (pathway impact > 0.1).