. 2018 Feb 1;9(10):2762–2767. doi: 10.1039/c7sc05452a

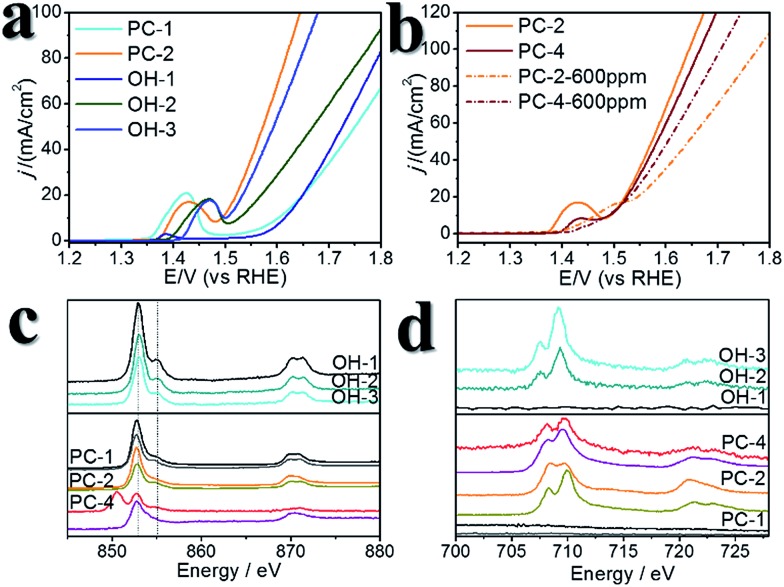
Fig. 5. Comparison between pyrite pre-catalysts and (oxy)hydroxides. (a) LSV curves of the (oxy)hydroxides, PC-1 and PC-2. (b) LSV curves of the pyrite pre-catalysts with and without additional S2– in the electrolyte. (c) Ni L-edge sXAS spectra. The upper panel shows the results for the (oxy)hydroxides, and the lower panel shows the results for the pyrite pre-catalysts. In the lower panel, the first spectrum below each label is the data for the corresponding pristine pyrite material, and the second spectrum below each label is the data for the corresponding pyrite pre-catalyst after 10 cycles of CV scans. (d) Fe L-edge sXAS spectra. The labelling manner is the same as that in (c).

Fig. 5