. 2018 Jan 31;9(9):2552–2558. doi: 10.1039/c7sc05087a

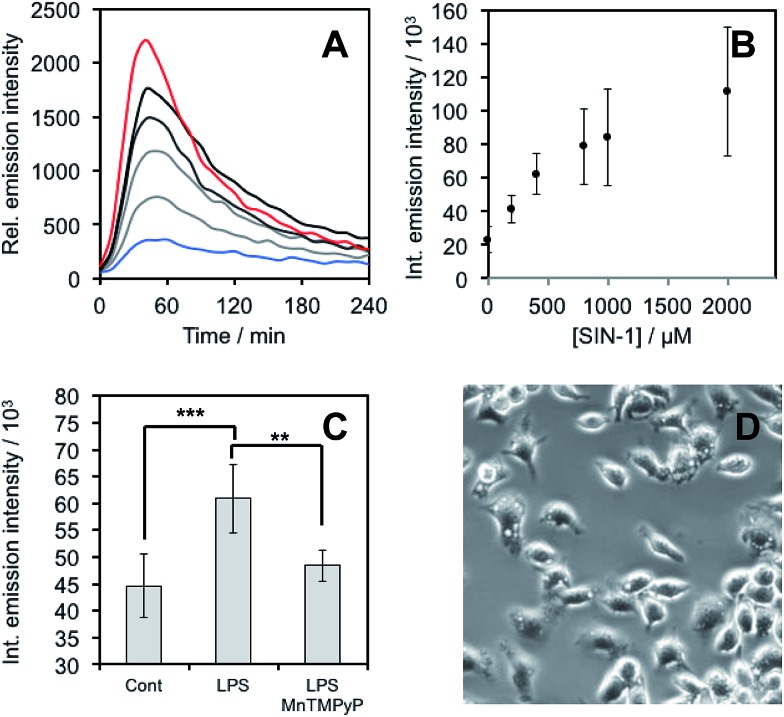
Fig. 6. ONOO detection in RAW 264.7 macrophages. (A) Time scans and (B) integrated intensity of chemiluminescence emission of RAW 264.7 macrophages incubated with 20 μM PNCL for 30 minutes, washed, and then treated with 0 (blue trace), 200 μM, 400 μM, 800 μM, 1 mM, and 2 mM (red trace) SIN-1. (C) Integrated chemiluminescent emission intensity of RAW 264.7 macrophages stimulated with (Cont) Vehicle control, (LPS) 1000 ng mL–1 LPS, or (LPS, MnTMPyP) 1000 ng mL–1 LPS and 25 μM Mn(iii)TMPyP and then treated with 20 μM PNCL. (D) Brightfield images of stimulated RAW 264.7 macrophages. Error bars are S.D. from n = 3–7 wells and 3 biological replicates (n = 10 wells from 6 biological replicates for the control experiment). Statistical significance was assessed using a two-tailed student's t-test. ***p < 0.001, **p < 0.01.

Fig. 6