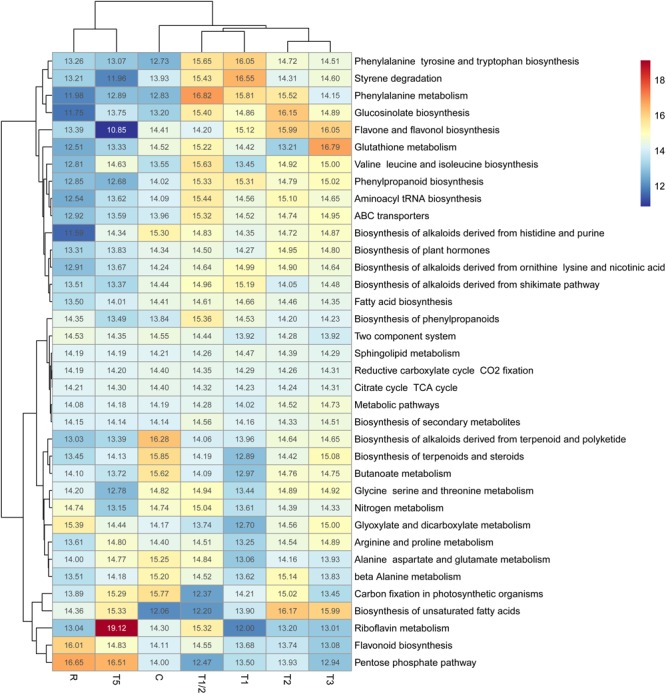
FIGURE 2.

Heatmap-clustering analyses of KEGG pathways considering only the pathways that exceed MBROLE FDR-correction (p < 0.05). Numbers inside the boxes indicate normalized abundance of each pathway (as a percentage) calculated as the sum of all identified/assigned metabolites within each pathway according to KEGG pathway. C, control; R, recovered; T1/2, 3 h after 40°C on day 1; T1, 6-h heat exposure on day 1; T2, day 2; T3, day 3; T5, day 5.
