Figure 5.
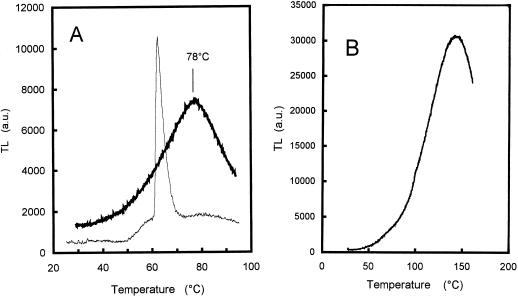
Eosin-induced lipid peroxidation in Arabidopsis leaf discs. A, TL curve of a wild-type Arabidopsis leaf disc before (thin line) and after (thick line) illumination (500 μmol m−2 s−1, 375 min) in the presence of eosin. The sharp 65°C TL band in control leaves is typical of Arabidopsis (and was not observed in other plant species such as tobacco, potato, or barley). The origin of this band is unknown; it is not related to lipid peroxidation and could be due to thermolysis of a (yet unidentified) volatile compound (Ducruet and Vavilin, 1998). B, TL was measured in a leaf disc kept for 1 h on filter paper in the dark after light stress (500 μmol m−2 s−1, 375 min) in the presence of eosin. The leaf water content decreased from 92.8% to 86.8% during this treatment.

