. 2018 Feb 9;9(10):2690–2697. doi: 10.1039/c7sc04733a

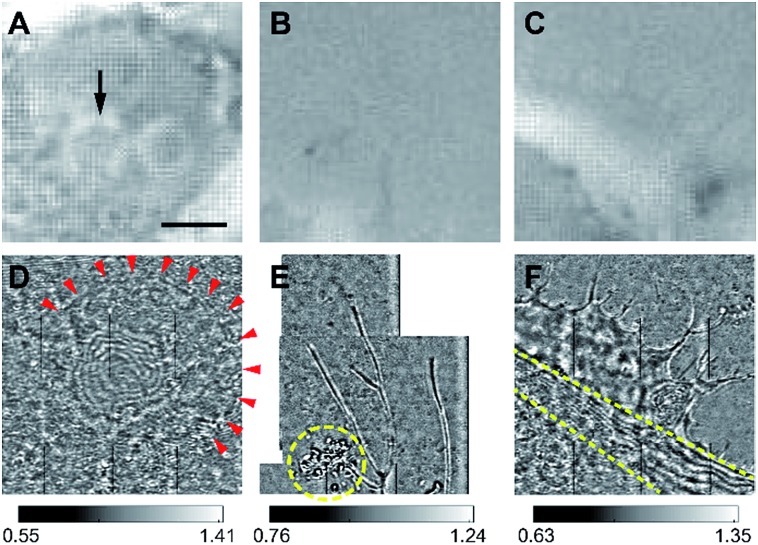
Fig. 6. Zoomed-in images for several cellular features from fixed COS-7 cells observed by phase contrast and iSCAT microscopy. (A and D) The cell nucleus visualized in phase contrast microscopy (A) and iSCAT microscopy (B). The boundary of a nucleus is visible in the iSCAT image (D) as indicated by red arrowheads for visual guidance. Moreover, the fringe pattern in the middle of iSCAT image corresponds to a round nuclear structure shown in the phase contrast image (A). (B and E) Narrow filopodia around the cell boundary revealed in phase contrast microscopy (B) and iSCAT microscopy (E). Compared to the phase contrast image (B), the iSCAT image shows significantly higher optical contrast, clearly displaying fine branched structures of filopodia as well as a number of nano-sized debris spreading around one branch (E). (C and F) Flat and thin lamellipodium revealed in phase contrast microscopy (C) and iSCAT microscopy (F). Although the boundary is still identifiable due to slight but detectable optical contrast, the lamellipodium basically appears to be flat in the phase contrast image (C). On the contrary, the height variation of the upper cell membrane manifests itself by forming strong fringes in the iSCAT image (F). For example, a region of cell membrane has a sharp incline towards the middle of the cell between two yellow dotted lines, while the boundary area of the cell appears to be so flat that approximately one run of contrast variation (from dark to bright and vice versa) occurs in the iSCAT image over a large region of lamellipodium (F). The scale bar is 10 μm.

Fig. 6