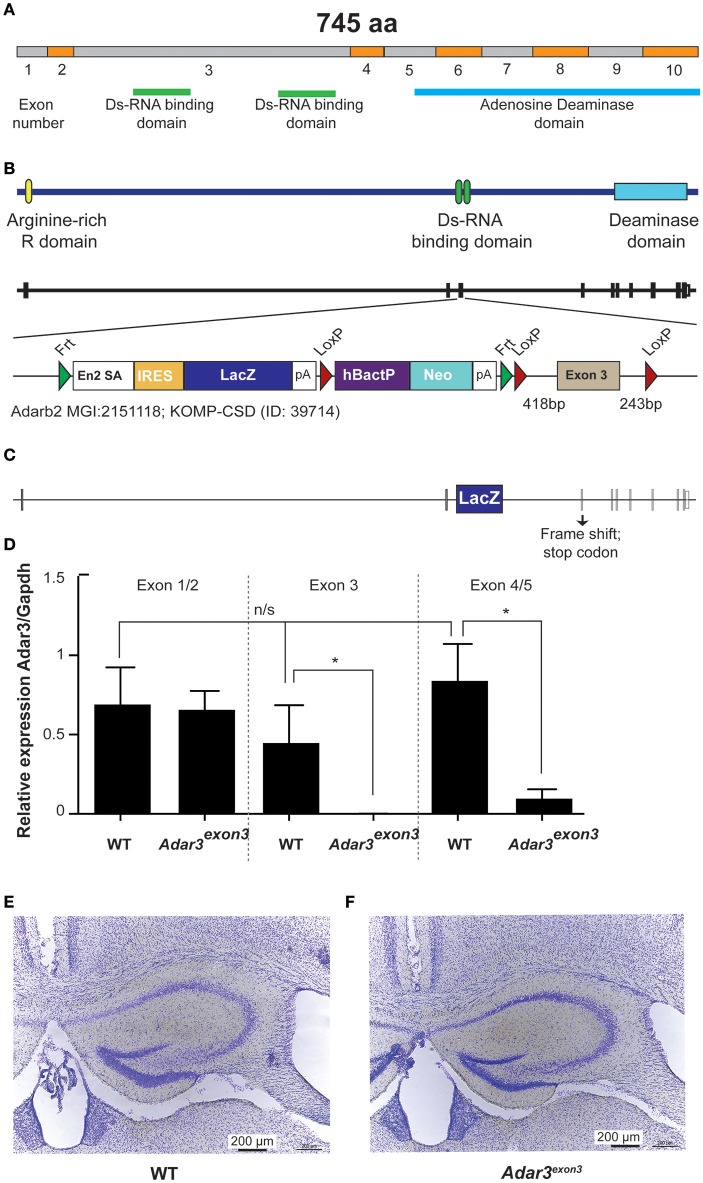
Figure 2.
Generation of Adar3exon3mice. (A) Schematic representation of Adar2b spliced mRNA structure with exons numbered and with the Ds-RNA binding and the Adenosine Deaminase domains shown. (B) Schematic of Adar3 knock-out allele. Adar3 intronic (lines) and exonic (bars) sequences are drawn to scale. (C) Schematic representation of the strategy used to remove exon 3 (containing the Ds-RNA binding domains). (D) Relative expression of Adar3 with respect to Gapdh, the relative mRNA level analysis was done by the ΔΔCt method (primers used were as follow 5′-3′: JM371_mADAR3_Ex1/2_f: GAGGTCCAAGAGGAAAGACA; JM372_mADAR3_Ex1/2_r: AGGTTATCTTCATCCTCTGTG; JM373_mADAR3_Ex3_r: TTCACTTCAGCACTGCTGGT; JM374_mADAR3_Ex4/5_f: TCGTCATGACCAAAGGCTTG). *Indicates P < 0.05; (E,F) No gross differences in the hippocampal formation between the WT and Adar3exon3 mice were found.

