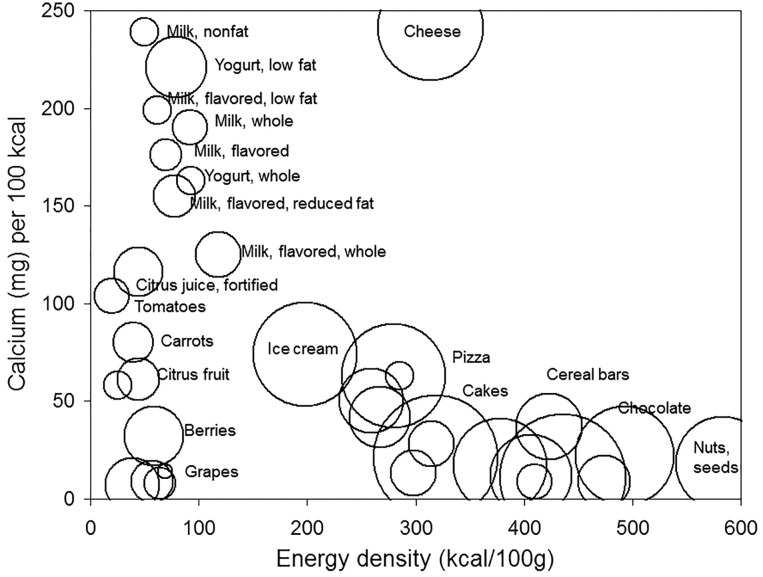
Figure 3.
The relationship between mean calcium content in milligrams per 100 kcal (mg/100 kcal) for selected food categories in the Food and Nutrient Database for Dietary Studies 2009–2010 dataset and their mean energy density (kcal/100 g). The size of the bubble represents the number of foods within each category.

