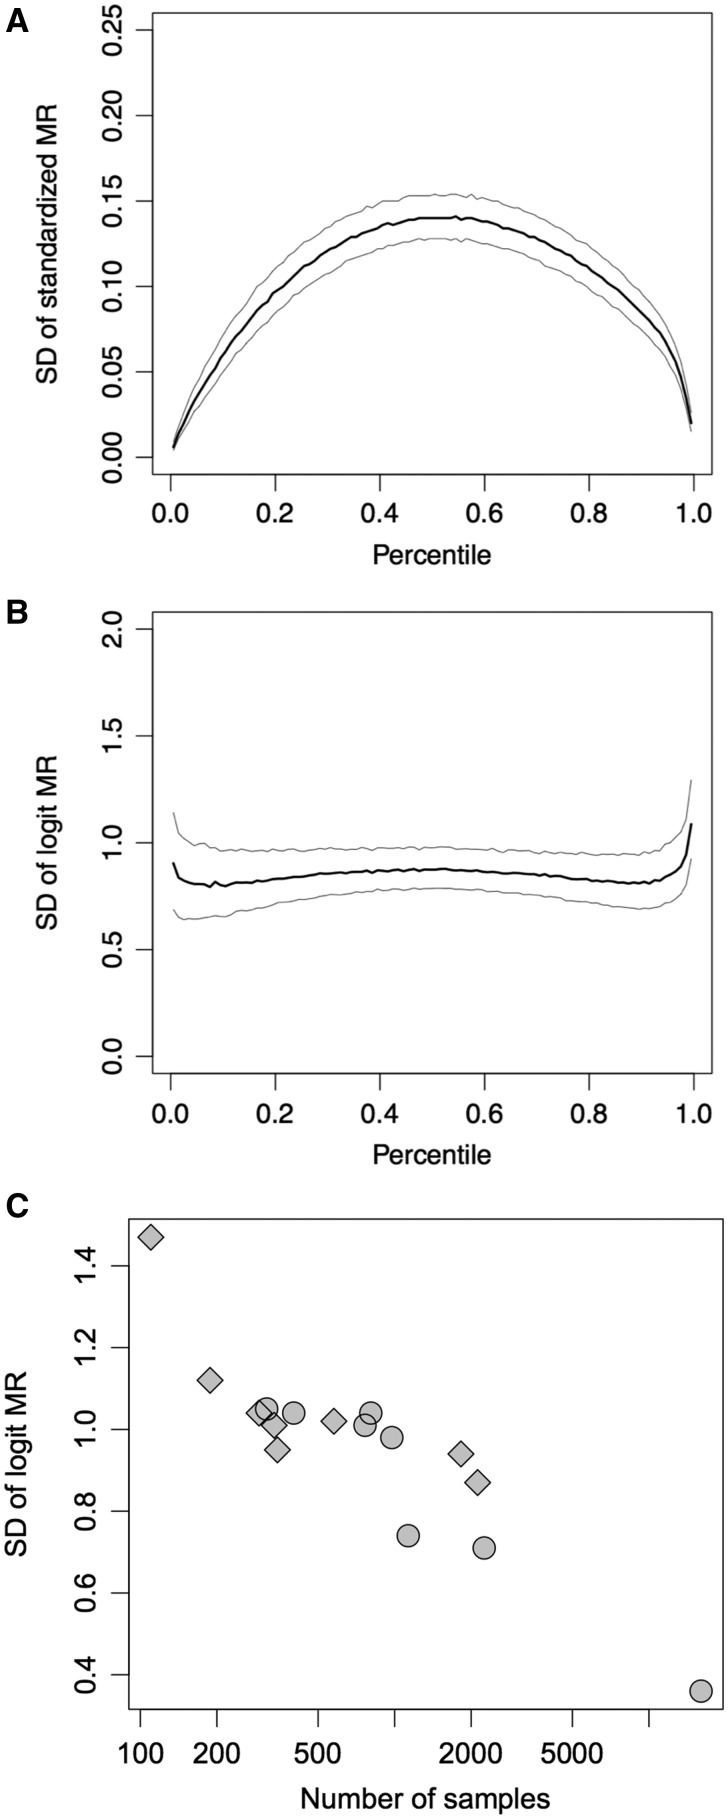
Fig. 2.
Properties of the error distribution of MR and logit-MR values. SDs of the bootstrapped MRs from RNAseq-based Arabidopsis coexpression data (Ath-r.c3-0) are shown. (A, B) SDs of bootstrapped MR values (A) and of logit-MR values (B) are shown against the mean of the bootstrapped MR values. The black lines show the median values with a sliding window corresponding to the 0.01 percentile of the MR without overlap, whereas the gray lines represent the first and third quantiles. (C) Mean SDs for the current 16 coexpression platforms in ATTED-II are plotted against the number of samples for each platform. Circles and diamonds indicate microarray-based and RNAseq-based coexpression datasets, respectively.

