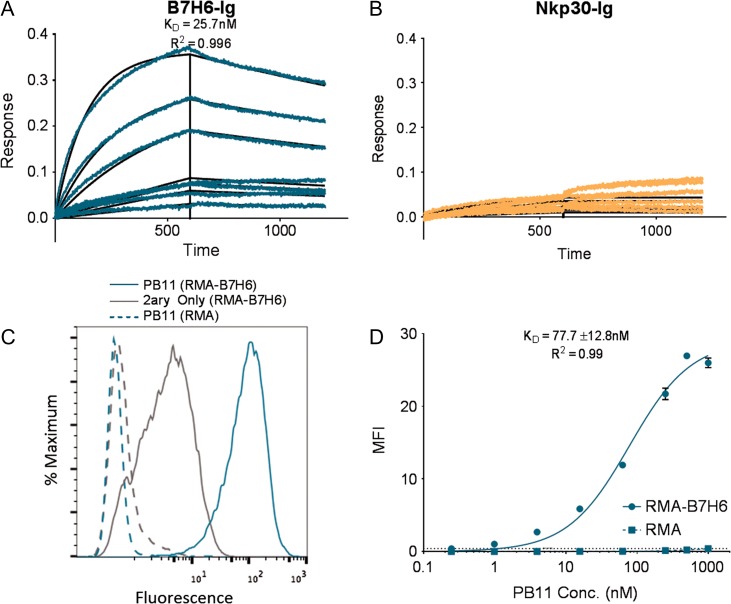
Fig. 3.
Binding characterization of soluble PB11 scFv-CH1-Fc. (A and B) Kinetic binding curves for the binding of soluble PB11 scFv-CH1-Fc to (A) B7H6-Ig and (B) Nkp30-Ig (negative control) were obtained by BioLayer Interferometry tested at a range of antigen concentrations from 0 to 500 nM. (C) Histograms depicting the staining of B7H6-expressing cells (RMA-B7H6, solid lines) and B7H6-null cells (RMA, dashed lines) with 500 nM PB11 scFv-CH1-Fc or secondary only. (D) Titration curves generated by staining B7H6-expressing cells (RMA-B7H6, solid) or B7H6-null cells (RMA, dashed) with varying concentrations of PB11 scFv-CH1-Fc ranging from 0 to 1000 nM. Error bars depict standard deviations of the MFI values from triplicate stains.

