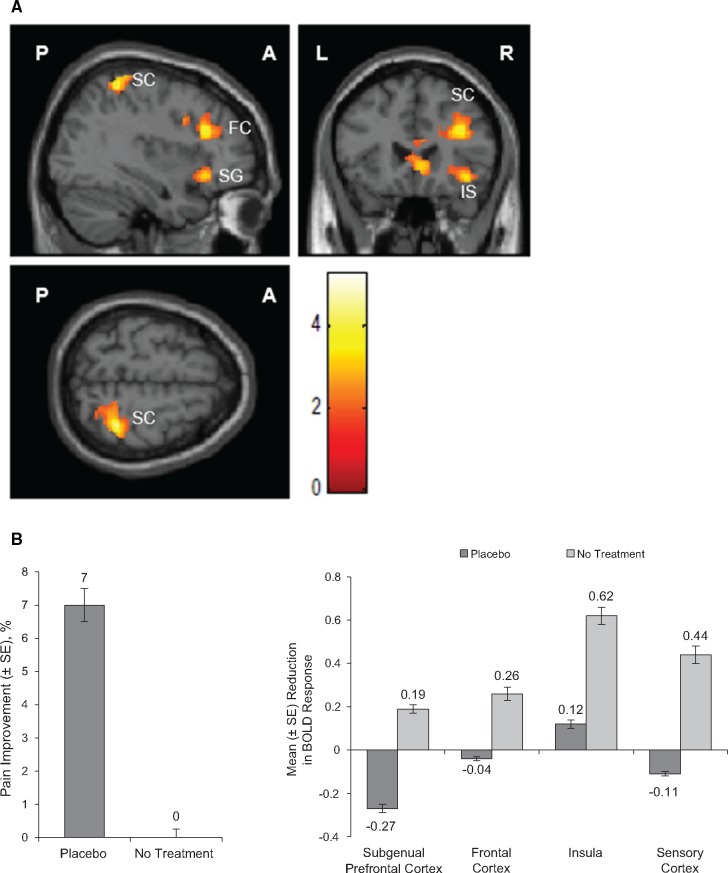
Figure 4.
Placebo vs no treatment. A) The combined functional magnetic resonance images of BOLD activation after painful stimulation at the knee joint following treatment with placebo vs no treatment. B) Left: mean change from baseline (%) in pain intensity after pressure stimulation following placebo treatment and no treatment. P = 0.03 for comparison of pretreatment pain intensity after stimulation and post-treatment pain intensity after stimulation prescan for placebo treatment; P = 0.99 for comparison of pain intensity after stimulation at the beginning and end of the no-treatment period prescan. Right: reduction of BOLD response after painful stimulation at the knee joint following treatment with placebo and no treatment. P < 0.001, subgenual prefrontal cortex; P < 0.001, frontal cortex; P = 0.003, insula; P < 0.001, sensory cortex. A = anterior; BOLD = blood oxygen level–dependent; ER-APAP = extended-release paracetamol; FC = frontal cortex; IS = insula; L = left side; P = posterior; R = right side; SC = sensory cortex; SE = standard error of mean; SG = subgenual prefrontal cortex.

