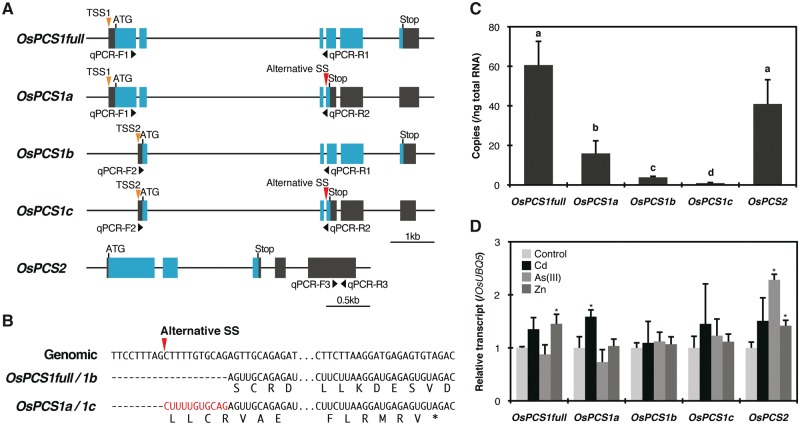
Fig. 1.
Isolation and characterization of OsPCS genes. (A) Predicted gene structures of OsPCS1 (Os06g0102300/LOC_Os06g01260) and OsPCS2 (Os05g0415200/LOC_Os05g34290). Black and blue boxes represent untranslated regions and coding regions, respectively. Approximate positions of real-time PCR primers, predicted transcription start sites (TSS1 and TSS2) and alternative splicing sites (SS) for OsPCS1 variants are denoted with black, orange and red triangles, respectively. (B) Alternative splicing sites at exon 4/3 of OsPCS1. An additional 11 bp coding sequence for OsPCS1a/1c is indicated in red. (C) Absolute quantification of OsPCS transcripts in rice roots by real-time RT–PCR. Data represent means with the SD of at least three biological replicates. Means sharing the same letter are not significantly different (P < 0.05, Tukey’s HSD). (D) Responses of OsPCS transcripts in rice roots exposed to Cd, As(III) and Zn excess treatment for 3 h. Data represent means with the SD of at least three biological replicates. Asterisks indicate significant differences from control for each variant (*P < 0.05; t-test).

