Fig. 3.
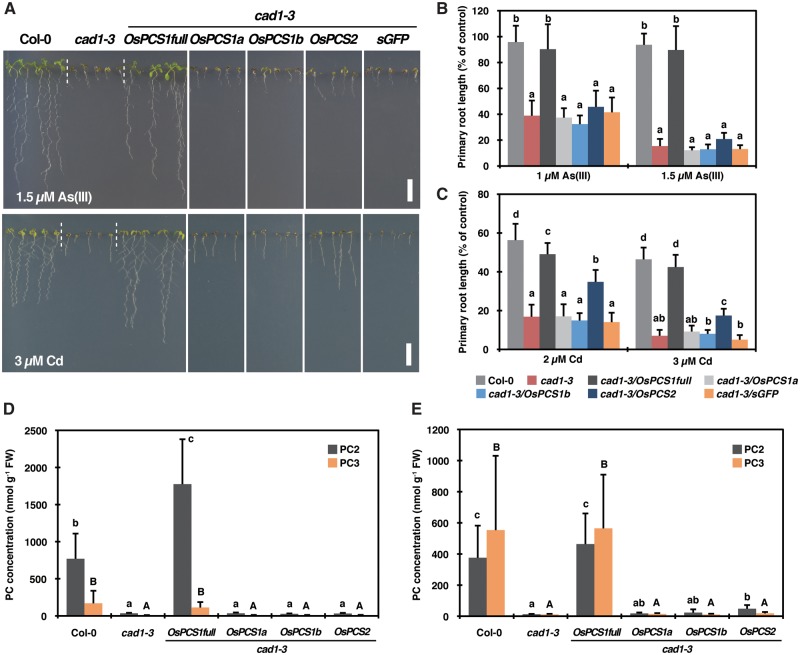
Complementation assay of OsPCS variants using the AtPCS1 null mutant cad1-3. (A) Phenotypes of Col-0, cad1-3 and cad1-3 transgenic plants expressing OsPCS variants or sGFP under control of the endogenous AtPCS1 promoter grown on medium containing 1.5 µM As(III) or 3 µM Cd for 12 d. Scale bar = 1 cm. (B and C) Relative primary root length of Col-0, cad1-3 and cad1-3 transgenic plants grown on medium containing As(III) (B) or Cd (C) for 12 d. Data represent means with the SD of two independent experiments (n = 13–25). Means sharing the same letter are not significantly different within each treatment (P < 0.05, Tukey’s HSD). (D and E) PC2 and PC3 concentrations in roots of Col-0, cad1-3 and cad1-3 transgenic plants exposed to As(III) (D) or Cd (E). Seven-day-old seedlings were transferred from the control medium to the medium containing 5 µM As(III) or 5 µM Cd and grown for 7 d before harvest. Data represent means with the SD of two independent experiments (n = 3–4). Means sharing the same lower case (PC2) and upper case (PC3) letter are not significantly different (P < 0.05, Tukey’s HSD).

