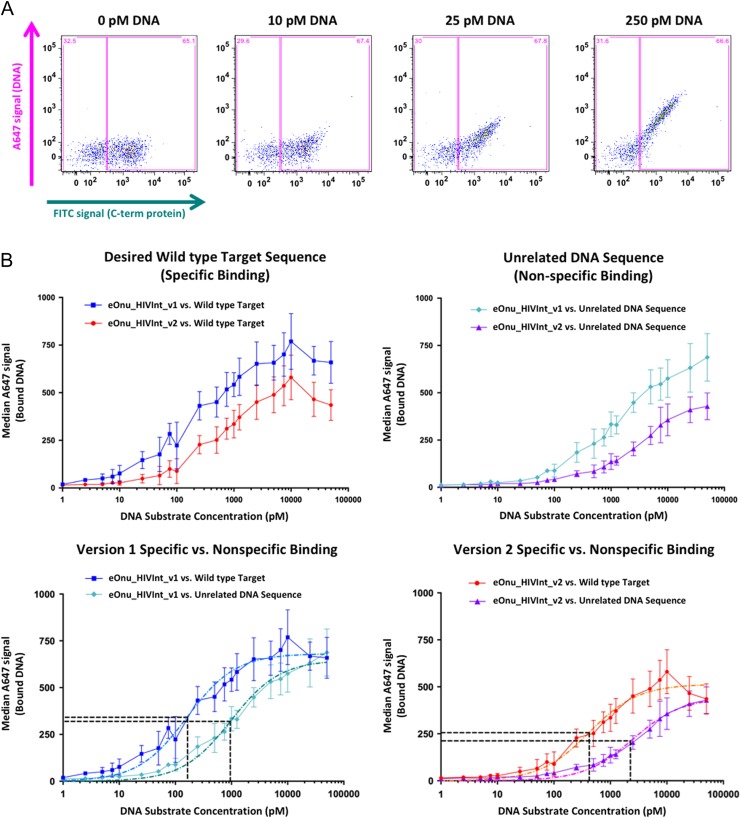
Fig. 8.
Specific vs. non-specific binding using a flow cytometric DNA binding assay. (A) Sample raw data from the flow cytometric binding assay. Cells are incubated with anti-Myc-FITC antibody (to stain for full-length protein expressed on the surface of yeast) and increasing concentrations of A647-labeled DNA target substrate. Gates (pink boxes) are drawn to separate the expressing and non-expressing cell populations, and DNA binding is quantified by measuring the median A647 signal from the expressing gate (DNA substrate bound by the enzyme after washing the cells). (B) Specific vs. non-specific DNA binding by eOnu_HIVInt version 1 and version 2 meganucleases. Median A647 signal (bound DNA) is plotted vs. increasing DNA substrate concentration for version 1 and version 2 meganucleases against the desired wild type DNA target sequence (specific binding, upper left graph) and an unrelated DNA target sequence (non-specific binding, upper right graph). Next, the same data is represented with specific vs. non-specific binding compared for each version of the enzyme separately (lower left and lower right graphs). Colors and shapes for the various datasets are indicated as follows: Binding of the original eOnu_HIVInt_v1 meganuclease to its wild type target (blue squares), binding of the redesigned eOnu_HIVInt_v2 meganuclease to its wild type target (red circles), binding of the version 1 enzyme to an unrelated DNA sequence (cyan diamonds), and binding of the version 2 enzyme to an unrelated DNA sequence (purple triangles). Dashed lines in the lower graphs represent curve fitting of the data (light blue, dark teal, orange, and magenta lines) and horizontal black lines indicate the Y and X values used for estimation of the specificity index for each version of the eOnu_HIVInt meganuclease (concentration of substrate at ‘half-max’). The numerical values determined by the curve fitting are as follows: HIVInt_v1 specific binding (light blue dashed curve) Ymax = 680, Y1/2_max = 340, X1/2_max = 163, HIVInt_v1 non-specific binding (dark teal dashed curve) Ymax = 638, Y1/2_max = 319, X1/2_max = 954. HIVInt_v2 specific binding (orange dashed curve) Ymax = 511, Y1/2_max = 256, X1/2_max = 421, HIVInt_v2 non-specific binding Ymax = 422, Y1/2_max = 211, X1/2_max = 2258. Error bars are shown for the standard deviation of three replicates, performed on independently induced yeast cultures on separate days. The A647 signal is strongly influenced by enzyme expression levels on the surface of yeast for each induced culture (varying for each replicate, as illustrated by the errors bars).

