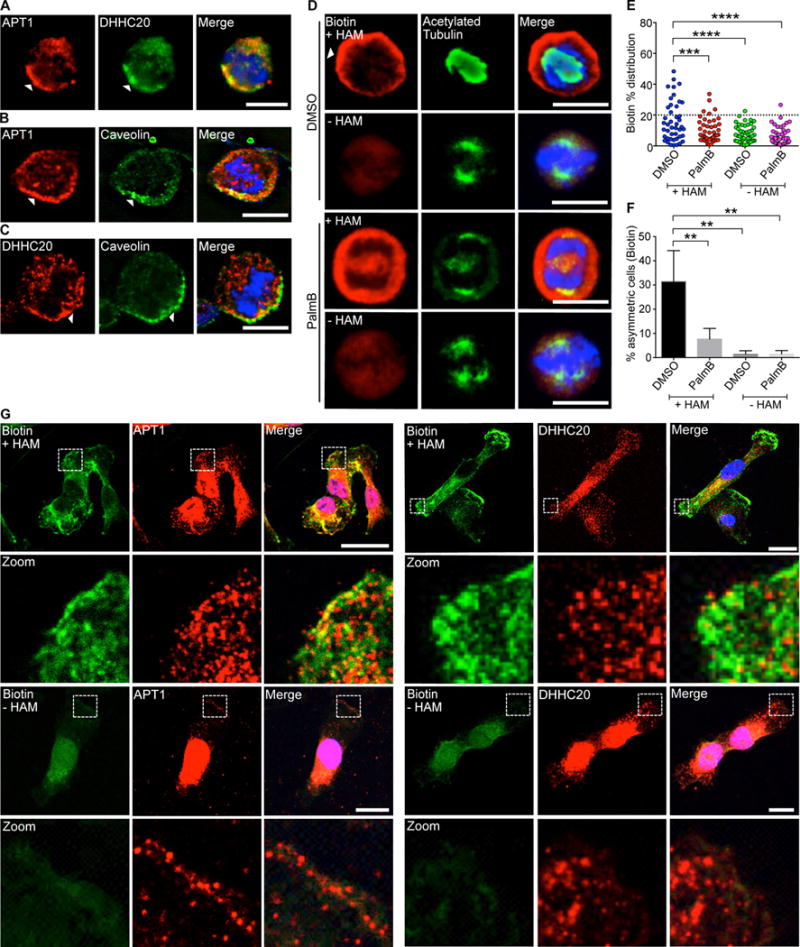
Fig. 3. Palmitoylating enzymes and depalmitoylating enzymes are asymmetrically partitioned during cell division.

(A) Images of dividing MDA-MB-231 cells stained to show endogenous APT1 (red), DHHC20 (green), and nuclei (blue). (B and C) Images of dividing MDA-MB-231 cells stained to show endogenous APT1 (B) or DHHC20 (C), caveolin, and nuclei. Asymmetric localization is indicated by arrowheads (A to C). (D) Images of dividing MDA-MB-231 cells treated with PalmB or DMSO and stained to show biotin-labeled palmitoylated proteins (red), acetylated tubulin (green), and nuclei (blue) by ABE immunofluorescence. Samples without hydroxylamine (-HAM) were negative controls for the ABE reaction. (E) Distribution dot plots showing the difference in mean fluorescence pixel intensity of biotin-labeled palmitoylated proteins. The distribution of the percentage differences of all quantified cells was plotted, and cells with a difference of >20% (dotted line) were scored as asymmetric. n = 91-101 cells scored for each experimental group. Each dot represents a single cell. Asterisks indicate statistically significant differences between the indicated groups. (F) Quantification of the number of dividing MDA-MB-231 cells showing asymmetric palmitoylated proteins after treatment with PalmB or DMSO control. (G) Confocal images of ABE immunofluorescence in non-dividing MDA-MB-231 cells showing all palmitoylated proteins (green), APT1 or DHHC20 (red), and nuclei (blue) by ABE immunofluorescence. White dotted boxes indicated magnified areas shown directly below (Zoom). Samples without hydroxylamine (-HAM) were negative controls for the ABE reaction. Scale bars (including zoom), 15μm. *P < 0.05 T-test. Error bars indicate standard deviation (SD).
