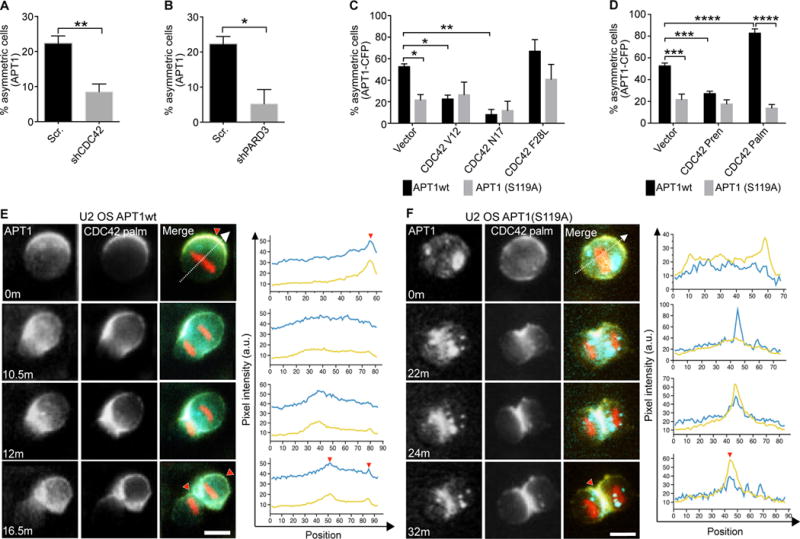
Fig. 4. The reciprocal interaction between APT1 and CDC42 establishes and maintains asymmetric protein partitioning during cell division.

(A and B) Quantification of the number of dividing MDA-MB-231 cells showing asymmetric localization of APT1 when CDC42 was knocked down with shCDC42 (A) or PARD3 was knocked down with shPARD3 (B). Cells expressing a scrambled (Scr) shRNA sequence were used as a negative control for knockdown. (C and D) Quantification of the number of dividing U2 OS cells showing asymmetric APT1WT-CFP or APT1S119A-CFP in cells expressing constitutively active (CDC42V12 and CDC42F28L) or dominant negative (CDC42N17) forms of CDC42 (C), or expressing isoforms of CDC42 that are prenylated (CDC42Pren) or both palmitoylated and prenylated (CDC42Palm) (D). (E and F) Time-lapse images of dividing U2 OS cells co-expressing CDC42Palm-YFP (yellow) and either APT1WT-CFP (E) or APT1S119A-CFP (F) (blue), and mCherry-Histone H2B (red). Overlapping CFP and YFP signal in the merge (green). Fluorescence pixel intensity was measured along the division axis (dashed line) and the corresponding pixel values of CDC42 (yellow line) and APT1 (blue line) along the division axis were plotted. Red arrowheads on images and corresponding graphs mark the peak asymmetric CDC42 and APT1 accumulation at the membrane or cytokinetic midbody. Time shown in minutes, m. Arbitrary units, a.u. Scale bars, 15 μm. n= 152-288 cells scored for each group from 4 independent experiments. *P < 0.05; **P < 0.01 T-test (A–D) and ANOVA (C, D). Error bars indicate standard deviation (SD).
