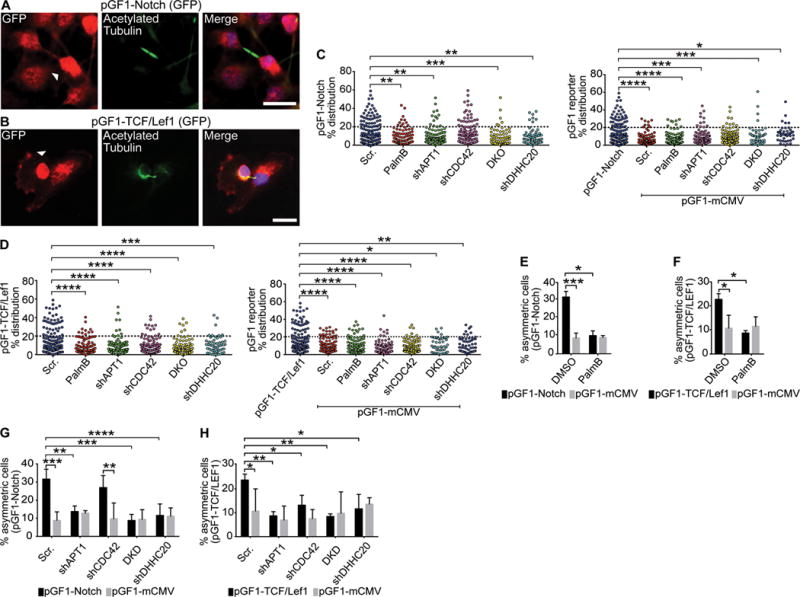
Fig. 5. APT1 restricts Wnt and Notch transcriptional activity to one daughter cell.

(A and B) Images of cytokinetic MDA-MB-231 cells stained to show expression of the pGF1-Notch GFP reporter (A) or pGF-1 TCF/Lef1 GFP reporter (B) (red), acetylated tubulin (green), and nuclei (blue). Arrowhead indicate asymmetric localization. Scale bars, 15μm. (C and D) Distribution dot plots showing the difference in mean fluorescence pixel intensity of pGF1-Notch reporter (C) or pGF1-TCF/Lef1 reporter (D) across dividing cells. Cells expressing an empty pGF1-mCMV GFP reporter were used as a negative control for the reporters. The distribution of the percentage differences of all quantified cells was plotted, and cells with a difference of >20% (dotted line) were scored as asymmetric. n= 784-822 cells scored for each experimental group. Each dot represents a single cell. Asterisks indicate statistically significant differences between the indicated groups. (E and F) Quantification of dividing MDA-MB-231 cells showing asymmetric localization of pGF1-Notch GFP reporter (E) or pGF1-TCF/Lef1 GFP reporter (F) (black bars) following treatment with PalmB or DMSO vehicle control. Cells expressing an empty pGF1-mCMV reporter (grey bars) were used as a negative control for reporter expression. (G and H) Quantification of the number of dividing MDA-MB-231 cells showing asymmetric localization of the pGF1-Notch GFP reporter (G) or pGF1-TCF/Lef1 GFP reporter (H) (black bars) when coexpressed with shAPT1, shCDC42, both shAPT1 and shCDC42 (DKD), and shDHHC20. Cells expressing an empty pGF1-mCMV GFP reporter (grey bars) were used as a negative control for reporter expression, and cells expressing a scrambled (Scr) shRNA sequence were used as a negative control for knockdown. *P < 0.05; **P < 0.01; ***P < 0.001; ****P < 0.001 T-test (between reporters and pGF1-mCMV) or ANOVA (C to H). Error bars indicate standard deviation (SD).
