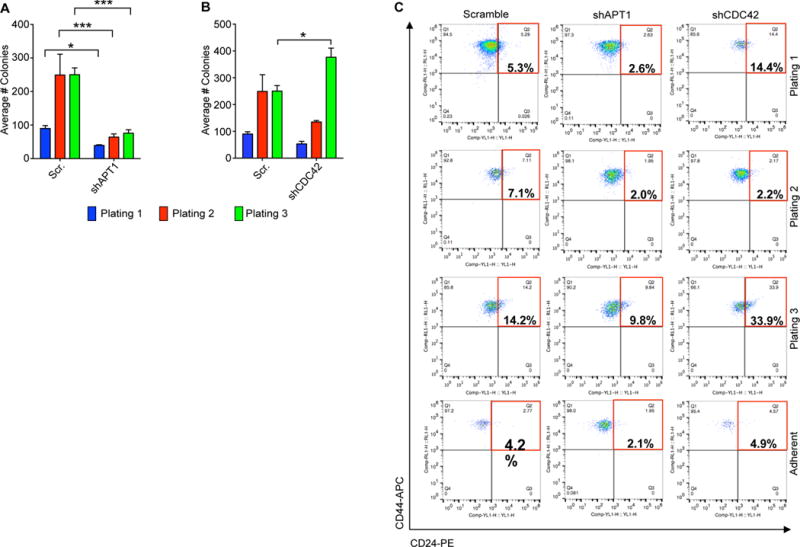
Fig. 7. APT1 and CDC42 maintain tumorigenic cell populations in MDA-MB-231 colonies.

(A and B) Quantification of the average number of colonies formed from MDA-MB-231 shAPT1 cells (A) or shCDC42 cells (B) over 3 serial replatings. Cells expressing a scrambled (Scr) shRNA sequence were used as a negative control for knockdown. Each graph shows means taken from three independent experiments. *P < 0.05; ***P < 0.0001 as measured by T-test. Error bars indicate standard error of the mean (SEM). (C) Representative flow cytometry analysis showing gating strategy of CD44+/CD24lo cells (red box) in cells dissociated from colonies or adherent. The population was gated off of ALDH+ cells shown in fig. S7. The percentages inside the red box indicate the relative proportion of the CD44+/CD24lo cell population. Cells were stained with phycoerythrin (PE)-conjugated anti-CD24 (CD24-PE) (x-axis) and allophycocyanin (APC)-conjugated CD44-APC (y-axis). Flow cytometry plots are representative of results from six independent experiments.
