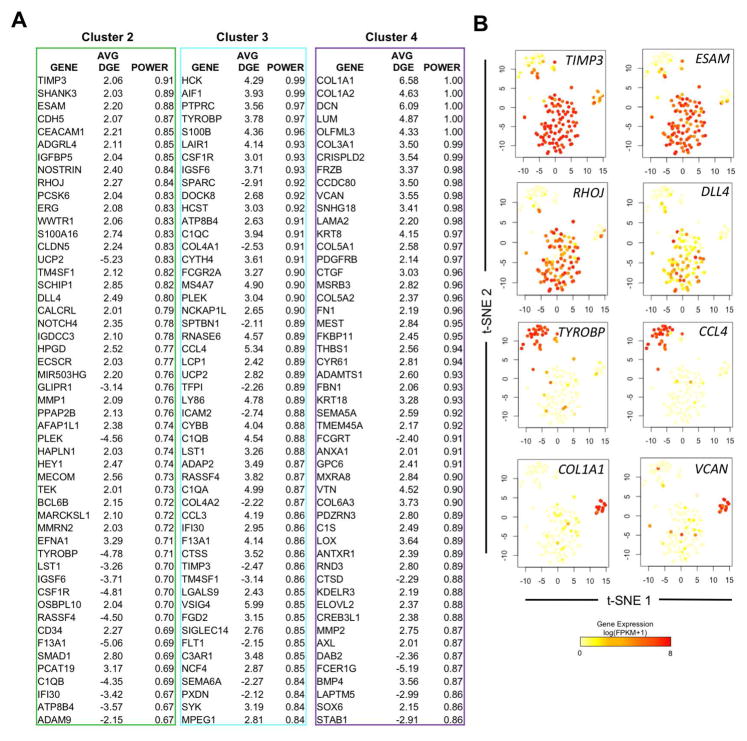
Figure 4. hESC-RUNX1c-tdTomato-derived non-HE are heterogeneous and can be distinguished from HE and HP using defined gene signatures.
(A) Lists of the top 50 differentially expressed genes that distinguish cells assigned in Cluster 2, 3, and 4 as shown in Figure 3D from the Total gene set. Gene screening was assessed by ROC analysis, with the average differential gene expression (Avg. DGE) and ROC classification power (0=random, 1=perfect correlation) for each gene listed; genes are ranked by their cluster distinguishing potential. (B) Gene expression superimposed onto Total t-SNE plots (Figure 3D) to reflect uniqueness to a cluster subset. Novel identifying biomarkers, such as TIMP3 and ESAM possess high expression within cells of Cluster 2 (mainly HE/HP), while TYROBP and CCL4 are uniquely expressed in Cluster 3 (non-HE), and ECM genes such as COL1A1 and VCAN are expressed in a distinct subset of non-HE cells within Cluster 4.

