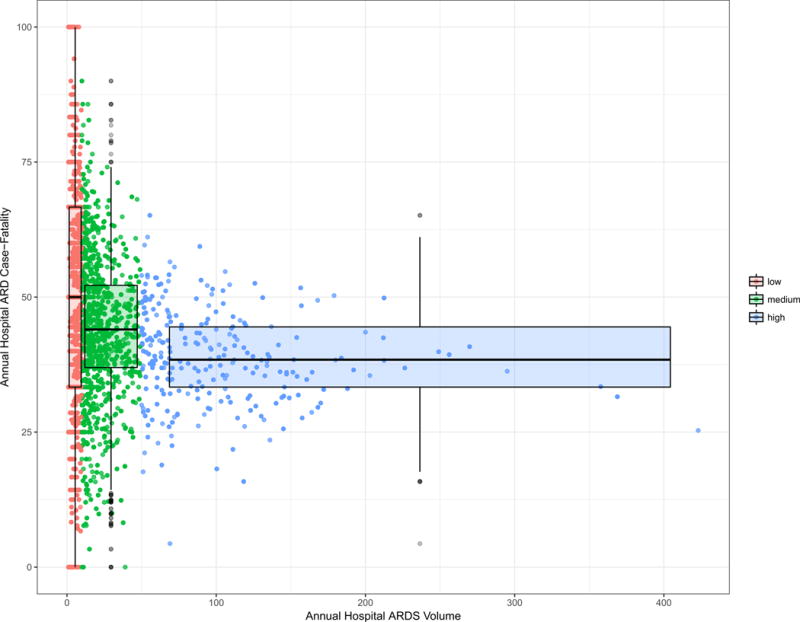
Figure 1. Average Annual Hospital ARDS Case Fatality Rate by Average Annual Case Volume, NIS 2002-2011 (N= 2,686 hospitals)a.

aData plotted are unadjusted average annual hospital case fatality rates by average annual ARDS case volumes among ARDS discharges. Points correspond to each hospital’s average annual mortality by the actual average hospital ARDS case volume while color signifies observations from low, medium, and high volume ARDS hospitals which corresponds to hospitals with 1-9, 10-49, and 50-431 cases annually. The lower and upper bounds of the box represent the 25th and 75th percentile, respectively. The whiskers represent 1.5 × the interquartile range. Box width is proportional to square-root of the number of observations in the group.
