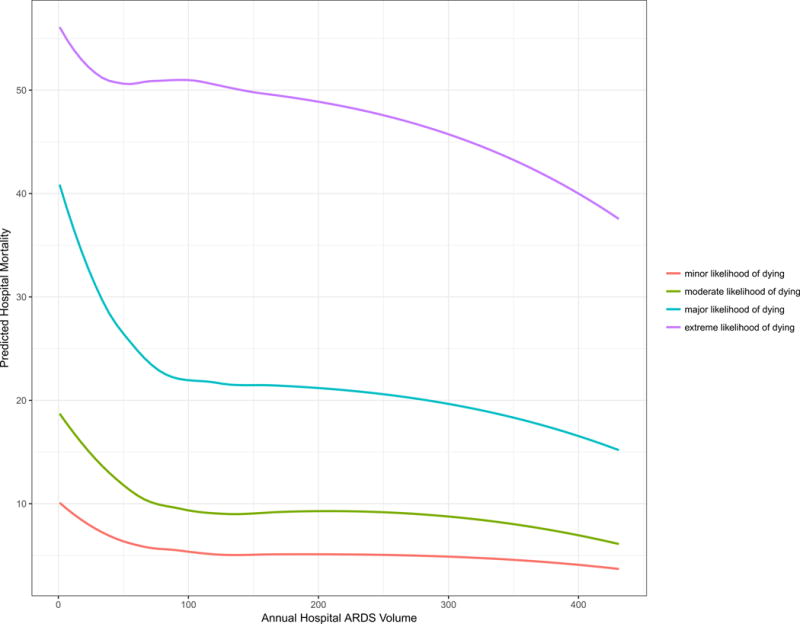
Figure 2. Adjusted In-Hospital Mortality by Annual Hospital ARDS Case Volume Stratified by Mortality Risk Group, NIS 2002-2011 (N= 117,204)a.

aData plotted are individual predicted hospital mortality by ARDS case volume category among ARDS discharges. Adjustment covariates include hospital, hospital teaching status and individual, sex, year of discharge, expected primary payer, and all payer diagnosis related group risk of mortality category, with an interaction term for risk category, and hospital ARDS volume category. Points correspond to each discharge’s predicted mortality by the actual hospital case volume for that year while color signifies observations from different underlying risk of mortality categories. The curves were created using the Loess method of ggplot2 package.
