
Figure 3. Simulated spatial profiles of acoustic field parameters.
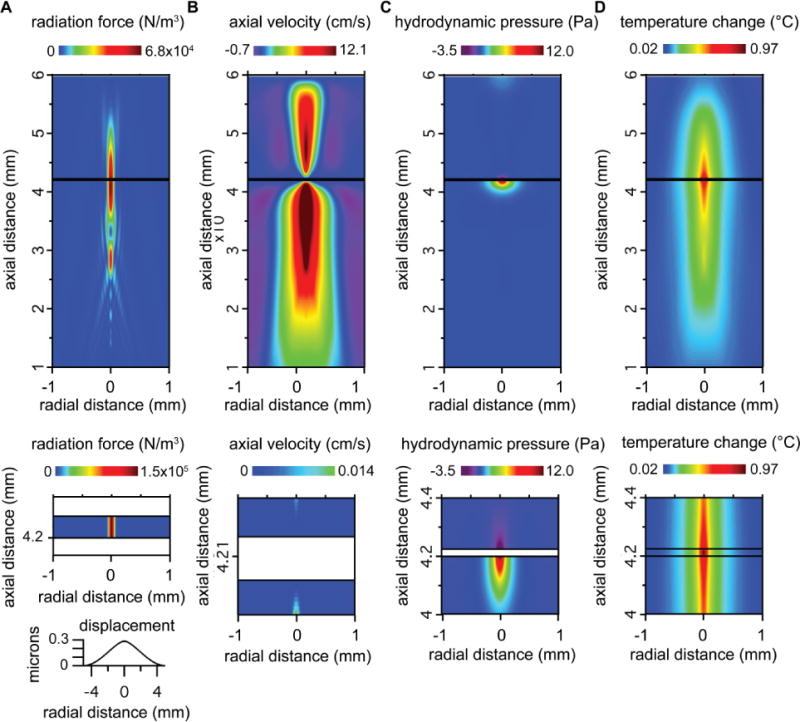
A. Acoustic radiation force in the liquid media (top panel) and in the polystyrene film (middle panel). The bottom panel shows the simulated displacement of the surface of the polystyrene film in response to acoustic radiation force. B. Axial component of the acoustic streaming velocity. The bottom panel shows the streaming velocity on an expanded scale, highlighting relevant features in the vicinity of the polystyrene film. C. Hydrodynamic pressure due to acoustic streaming (shown on an expanded scale in the bottom panel). D. Steady-state temperature change (shown on an expanded scale in the bottom panel).
Axial distances are relative to the surface of the transducer and radial distances are relative to the center of the ultrasound (US) beam. Results are shown for US at 90 W/cm2 and 25-micron polystyrene film. Similar results were obtained for US at 50 W/cm2 and 50-micron polystyrene (not shown). Changing the US intensity or the thickness of the polystyrene film changed the amplitude of the acoustic field parameters but did not substantially change their spatial profile.