
Figure 5. Effects of ultrasound (US) on NaV1.2 Channels.
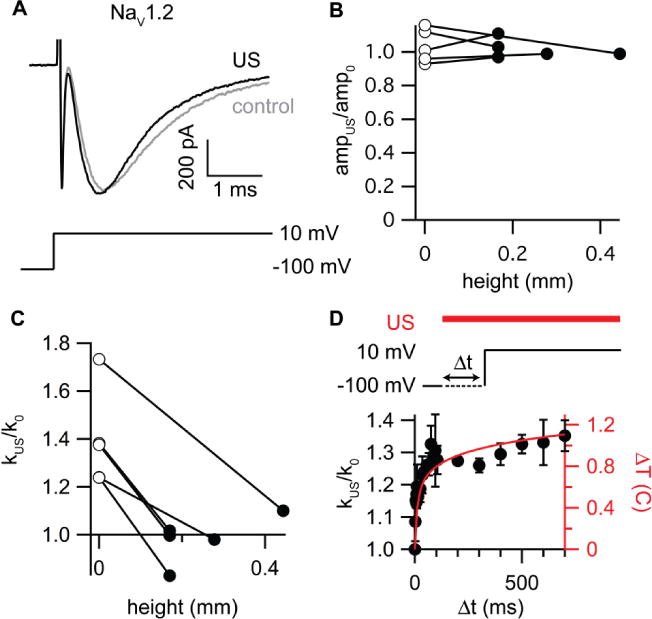
A. Example currents for NaV1.2 channels (in adhered cells at ground level) in response to a voltage step from −100 to −10 mV with (black current trace) and without (grey current trace) stimulation. The 90-W/cm2, 1-s US stimulus was applied starting 800 ms before the voltage step. B. Ratio of the NaV1.2 current amplitude at −10 mV in the US condition to the amplitude in the control condition (ampUS/amp0) for five detached cells at zero height (open circles) and at various heights above the bottom of the experimental chamber (black circles), for the same stimulus protocol used in A. There was no significant effect of height on the amplitude ratio (paired t-test, P = 0.71). C. Ratio of the NaV1.2 inactivation rate at −10 mV in the US condition to the inactivation rate in the control condition (kUS/k0) in five detached cells at zero height (open circles) and at various heights above the bottom of the experimental chamber (black circles), for the same stimulus protocol used in part A. The difference was statistically significant (paired t-test, P = 0.001, N = 5) D. Comparison of the time courses of simulated acoustic heating and effects of US on NaV1.2 channel inactivation. The mean (± standard deviation (SD)) ratio of the NaV1.2 inactivation rate at −10 mV in the US condition to the inactivation rate in the control condition (kUS/k0) is shown as a function of the US exposure time (Δt) prior to the voltage step for N = 4 different cells at each interval, along with the simulated temperature change as a function of the time relative to the start of the US stimulus (red line, right axis). The experiments and simulation were done with 50-micron polystyrene.