. 2018 Feb 13;9(11):2909–2917. doi: 10.1039/c7sc05089e

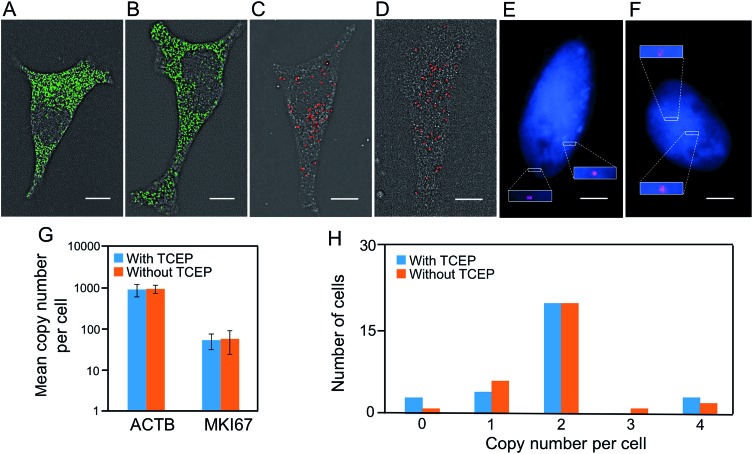
Fig. 3. (A) After incubation with TCEP for 24 hours, ACTB transcripts are detected with ON-N3-Quasar 570 using the direct staining approach. (B) Without incubation with TCEP, ACTB transcripts are detected by conventional RNA FISH. (C) After incubation with TCEP for 24 hours, MKI67 transcripts are detected with ON-N3-Cy5 using the indirect staining approach. (D) Without TCEP incubation, MKI67 transcripts are detected by conventional RNA FISH. (E) After incubation with TCEP for 24 hours, genomic locus 4p16.1 is detected with ON-N3-Cy5 using the indirect staining approach. (F) Without incubation with TCEP, genomic locus 4p16.1 is detected by conventional DNA FISH. Cell nuclei are stained with DAPI (blue) in (E) and (F). (G) The mean copy number of ACTB and MKI67 transcripts per cell obtained with and without the TCEP treatment before hybridization (P > 0.3; error bars, s.d.; n = 30 cells). The y axe in (G) is on a logarithmic scale. (H) Copy numbers of genomic locus 4p16.1 per cell (n = 30 cells) obtained with and without the TCEP treatment before hybridization. Scale bars, 5 μm.

Fig. 3