. 2018 Feb 13;9(11):2909–2917. doi: 10.1039/c7sc05089e

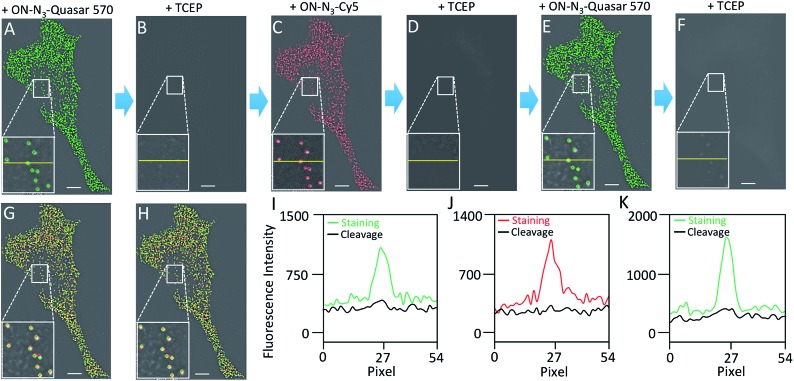
Fig. 4. (A) GAPDH transcripts are detected with ON-N3-Quasar 570 using the indirect staining approach. (B) Quasar 570 is cleaved by TCEP. (C) In the second cycle, GAPDH transcripts in the same cell are stained using ON-N3-Cy5. (D) Cy5 is cleaved by TCEP. (E) In the third cycle, GAPDH transcripts in the same cell are stained using ON-N3-Quasar 570. (F) Quasar 570 is cleaved by TCEP. (G) Digital overlay of (A) and (C). (H) Digital overlay of (C) and (E). (I) Fluorescence intensity profiles corresponding to the yellow lines positions in (A) and (B). (J) Fluorescence intensity profiles corresponding to the yellow lines positions in (C) and (D). (K) Fluorescence intensity profiles corresponding to the yellow lines positions in (E) and (F). Scale bars, 5 μm.

Fig. 4