
Table 2.
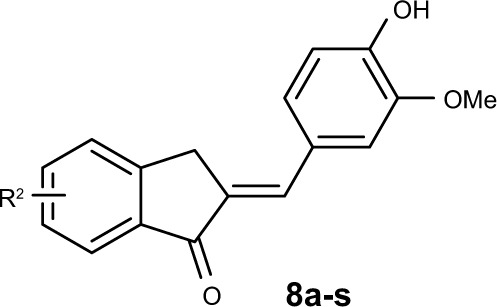
2-benzylidene-1-indanone derivatives 8a-s inhibited LPS-induced IL-6 and TNF-α secretion in MPM
| |||||||||
|---|---|---|---|---|---|---|---|---|---|
| Compound | R2 | (%) Inhibition (10 µM)*
|
HL7702 cell
|
Compound | R2 | (%) Inhibition (10 µM)*
|
HL7702 cell
|
||
| IL-6 | TNF-α | Survival rate (%) | IL-6 | TNF-α | Survival rate (%) | ||||
| 4d | 6-OH | 69.12±4.29 | 80.80±3.33 | 77.43±3.69 | 8j | 4-OPr | 69.13±1.76 | 41.63±1.38 | 93.96±7.95 |
| 8a | 7-OH | 40.00±1.65 | 44.65±1.31 | 84.92±4.16 | 8k | 7-O(i-Pr) | 83.17±0.60 | 62.85±1.05 | 70.03±7.54 |
| 8b | 5-OH | 17.15±2.77 | NA | 82.68±5.95 | 8l | 6-O(i-Pr) | 78.45±1.46 | 56.85±7.76 | 89.64±6.97 |
| 8c | 6-OMe | 50.07±4.14 | 37.71±1.65 | 96.36±3.84 | 8m | 5-O(i-Pr) | 62.53±4.05 | 16.67±4.75 | 97.62±1.87 |
| 8d | 5-OMe | 40.04±1.60 | 48.27±2.33 | 98.31±1.92 | 8n | 4-O(i-Pr) | 49.99±1.77 | 35.92±2.38 | 75.61±5.71 |
| 8e | 4-OMe | 56.36±2.05 | 60.27±2.04 | 82.75±4.23 | 8o | 6-N(Et)2 | 50.05±4.75 | 29.12±2.48 | 85.90±6.81 |
| 8f | 5,6-OMe | 81.41±3.68 | 79.29±2.55 | 91.09±1.12 | 8p | 6-N(–CH2–)4 | 74.11±3.61 | 68.93±0.99 | 96.47±3.13 |
| 8g | 7-OPr | 84.92±1.10 | 71.99±0.88 | 74.06±4.28 | 8q | 6-N(–CH2–)5 | 69.71±2.32 | 39.14±3.27 | 99.01±2.03 |
| 8h | 6-OPr | 57.74±5.84 | 55.36±6.48 | 97.00±1.69 | 8r | 6-N(–CH2–)6 | 62.50±4.48 | 56.37±4.22 | 98.58±8.14 |
| 8i | 5-OPr | 76.62±2.67 | NA | 92.83±6.16 | 8s | 6-NH-COMe | 18.60±2.88 | 24.78±1.66 | 85.85±1.65 |
Notes: Macrophages were plated at a density of 5.0×10⁵/plate at 37°C and 5% CO2 overnight. Cells were pretreated with vehicle and compounds (10 µM) for 30 min, and subsequently treated with LPS (0.5 µg/mL) for 24 h. The culture media were collected and the inflammatory cytokines, TNF-α and IL-6, in media were detected by ELISA and normalized by total protein concentration.
Values are the mean of at least n=3 independent experiments±SEM.
Abbreviations: IL-6, interleukin-6; LPS, lipopolysaccharide; TNF-α, tumor necrosis factor-α; MPM, murine primary macrophage; ELISA, enzyme-linked immunosorbent assay; NA, no activity; SEM, standard error of the mean.