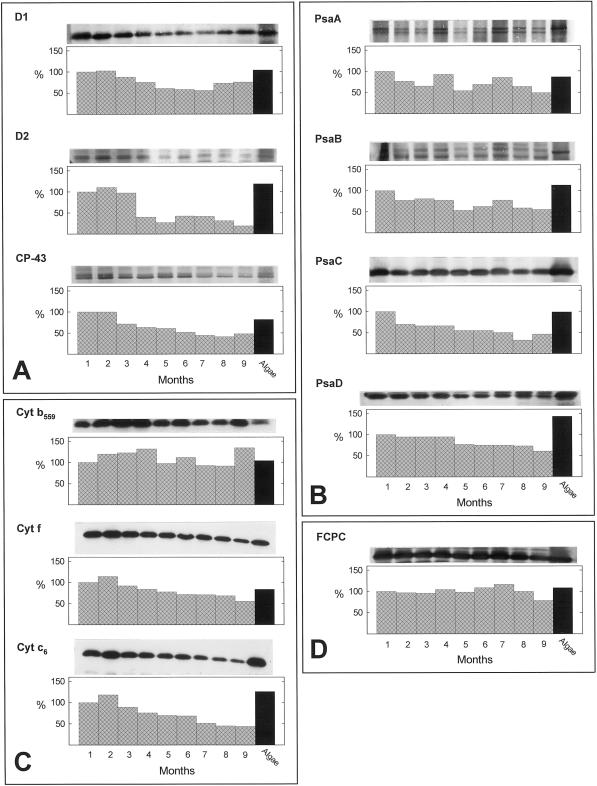
Figure 3.
Immunoblot analysis of chloroplast polypeptides from E. chlorotica over a 9-month culture period in the absence of algae, and V. litorea. The western blot is shown above the corresponding graph of densitometric quantification of each protein. Antibodies used are listed to the left of each panel. For PsaA and PsaB, the larger molecular mass band of the two shown was quantified. A, PSII proteins; B, PSI proteins; C, mobile electron carriers, and D, LHCP. Lanes 1 through 9, E. chlorotica months 1 through 9 of culture; algae lane, V. litorea. The value obtained for month 1 in E. chlorotica (lane 1) was set at 100% and all other values calculated relative to this control.

