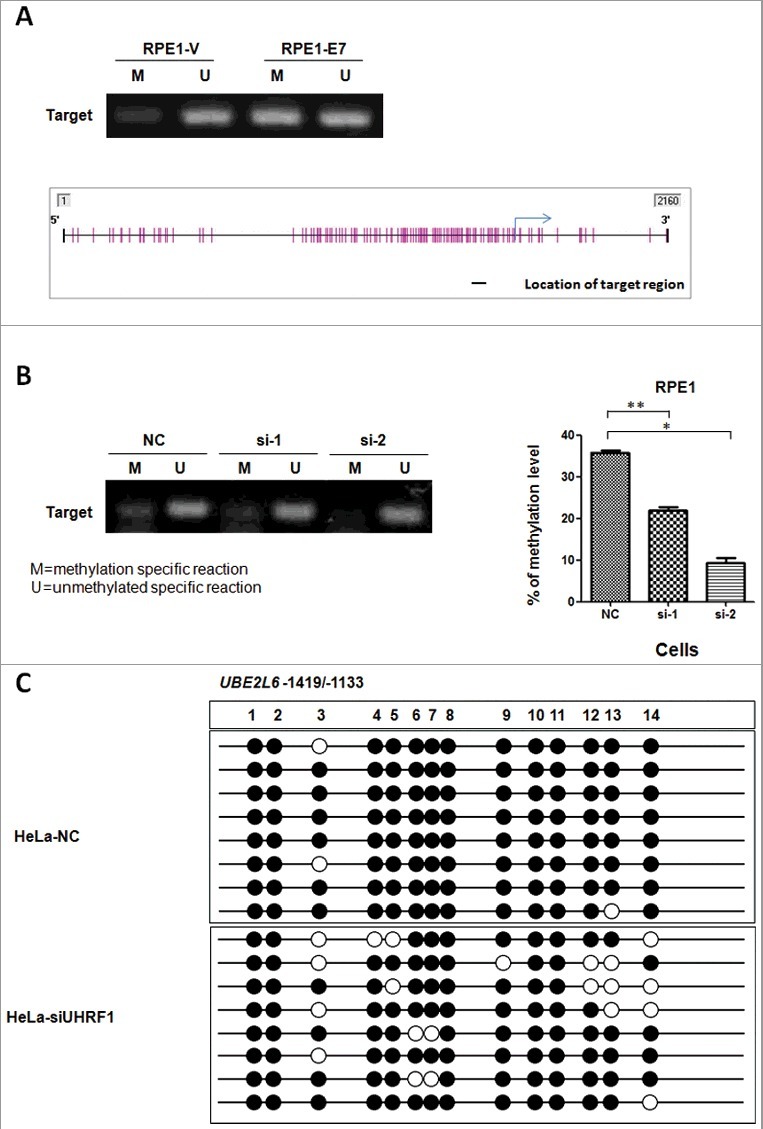
Figure 4.

Elevated level of methylation on UBE2L6 promoter in E7 expressing cells. (A) MSP performed using extracts from RPE1-Vector and RPE1-E7 cells. M, Methylation specific primer. U, Unmethylated specific primer. The location of target region amplified by the primer set in predicted CpG islands were indicated with black short lines. The blue arrow indicated transcription start site (TSS) and the purple short vertical lines represented CpG sites. (B) MSP in E7 expressing cells after knockdown UHRF1 by methylation specific and unmethylated primer set. (C) BSP using primers in predicted CpG islands in HeLa cells before and after UHRF1 knock-down.
