Figure 2.

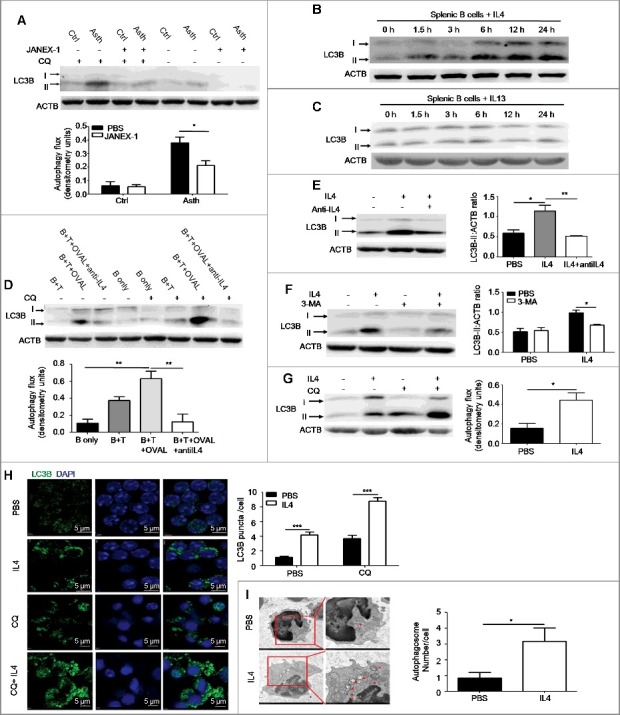
Autophagy is induced by IL4 in primary B cells. (A) WT asthma-prone mice were pretreated with the JAK3 inhibitor JANEX-1 before atomized OVAL challenge. Autophagy flux in isolated pulmonary B cells of asthma-prone mice was assessed as in Figure 1(A). Ctrl, control mice; Asth, asthma-prone mice. Bar graph represents mean ± SEM of autophagy flux; *P < 0.05, determined by the Student t test. Data are representative of 3 independent experiments. (B and C) Murine splenic B cells were treated with murine IL4 (B) or IL13 (C) for different times (1.5, 3, 6, 12 and 24 h). The accumulation of LC3B-II was assessed by immunoblotting of whole cell lysates. Data are representative of 3 independent experiments. (D) Pulmonary CD4+ T cells of WT asthma-prone mice were cocultured with splenic B cells of WT control mice in the presence of OVAL and/or anti-IL4 (IL4 neutralizing antibody) according to experiment designs. Then cocultured B cells were purified, autophagy flux was assessed as in Figure 1(A). B, B cells; T, CD4+ T cells. Bar graph represents mean ± SEM of autophagy flux; **P < 0.01, determined by ANOVA with the Tukey post hoc test. Data are representative of 3 independent experiments. (E to G) Murine splenic B cells were treated with IL4 in the presence or absence of anti-IL4 (IL4 neutralizing antibody) for 24 h (E); or treated with IL4 or/and 3-MA for 24 h (F); or treated with IL4 for 24 h, and then CQ for the last 6 h (G). Accumulation of LC3B-II was measured by immunoblotting of whole cell lysates, autophagy flux was measured as in Figure 1(A). Bar graphs (mean ± SEM) in (E) and (F) represent ACTB-normalized LC3B-II density values. Bar graph in (G) represents mean ± SEM of autophagy flux; *P < 0.05, **P<0.01, determined by ANOVA with the Tukey post hoc test (E); *P<0.05, calculated by the Student t test (F and G). Data are representative of 3 independent experiments. (H) Murine splenic B cells were treated with IL4 for 24 h, and then CQ was added for the last 6 h, LC3B puncta were observed by confocal microscopy. Bar graph (mean ± SEM) represents the number of LC3B puncta per cell from analysis of 100 cells per condition. DAPI was used to denote the cell nucleus. Magnification × 600; scale bars: 5 μm. ***, P<0.001, determined by the Student t test. Data are representative of 3 independent experiments. (I) Murine splenic B cells were left untreated or treated with IL4 for 24 h, double-membrane autophagosomes were observed by transmission electron microscopy. Red arrows showed autophagosomes. Bar graph (mean ± SEM) represents the number of double-membrane autophagosomes per cell by counting 20 cells per condition; *, P<0.05, determined by the Mann-Whitney test. Data are representative of 2 independent experiments.
