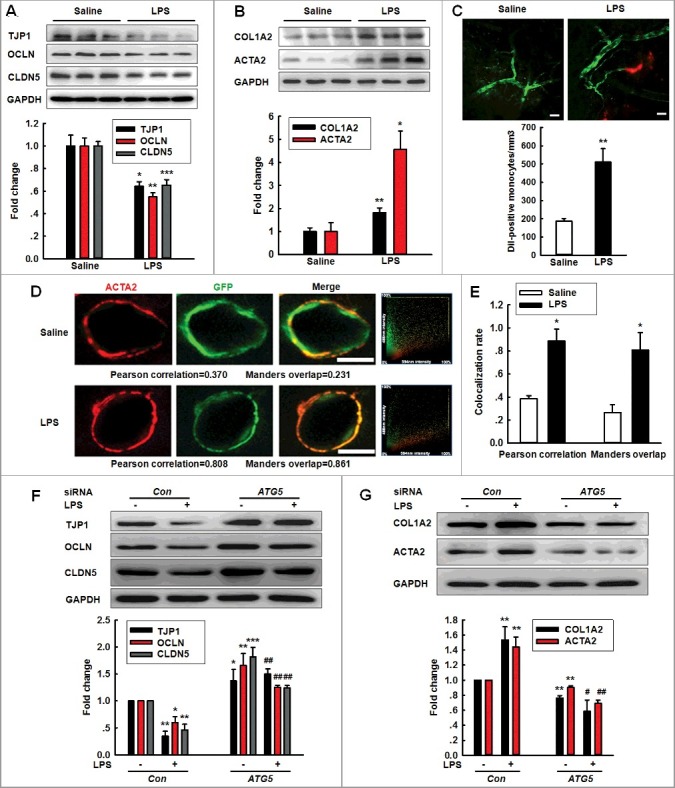
Figure 3.

Role of ATG5 in LPS-induced EndoMT. (A and B) Effects of LPS treatment on the expression of TJP (TJP1, OCLN and CLDN5) (A) and mesenchymal cell markers (COL1A2 and ACTA2) (B) in vivo. (C) The number of Dil-labeled monocytes increased out of the blood vessels of LPS-treated TEK-GFP transgenic mice compared with that in the saline treatment. Mice were treated with LPS (0.83 mg/kg) once per day for 7 d and were subsequently accessed via TPLSM. Scale bar: 50 μm. (D and E) Effect of LPS on the GFP+ and ACTA2 colocalization in vivo. Immunostaining for ACTA2 in the hippocampus from TEK-GFP transgenic mice. Z-tack images were acquired on a Carl Zeiss confocal laser scanning microscope (D). The Pearson correlation or Manders overlap of the GFP+ and ACTA2 immunofluorescence was calculated, respectively (E). Scale bar: 5 μm. Mice were administered LPS (0.83 mg/kg) once per day for 7 d. n = 6 animals/group. *P<0.05, **P<0.01, ***P<0.001 vs. saline group using the Mann-Whitney test. (F and G) Transfection of HBMECs with siRNA ATG5 significantly inhibited the decreases in the TJP expression levels (F) and the increases in the mesenchymal cell marker expression (G). HBMECs were cultured for 24 h after the transfection of ATG5 siRNA and were subsequently exposed to LPS (10 ng/ml) for 24 h. All data are presented as the mean ± SD of 3 independent experiments. *P<0.05, **P<0.01, ***P<0.001 vs. the siRNA-control group. #P<0.05, ##P<0.01 vs. the LPS-incubated siRNA-control via one-way ANOVA followed by the Holm-Sidak test.
