
Figure 1.
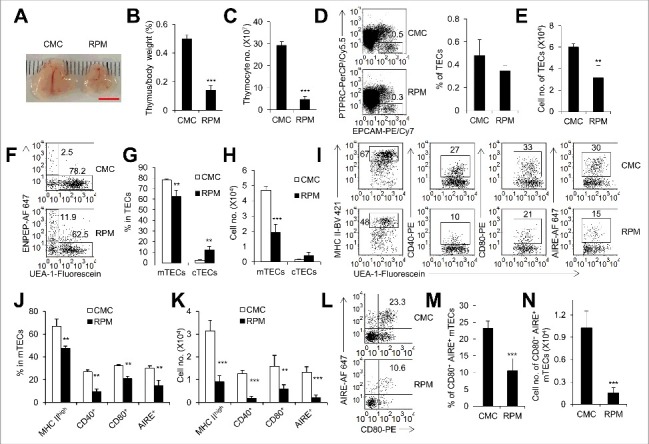
Inhibition of MTOR activity caused thymus atrophy. (A) Representative picture of thymi from mice treated with rapamycin (RPM) or carboxymethyl cellulose sodium (CMC) for 7 d. Scale bar: 5 mm. The ratio of thymus weight to body weight (B) and thymocyte number (C) of control (n = 4) and RPM-treated mice (n = 5). (D) Representative flow cytometry data and frequency of TECs in control mice (n = 4) and RPM-treated mice (n = 5). TECs were defined as PTPRC− EPCAM+ cells. (E) Cell numbers of TECs in control mice (n = 4) and RPM-treated mice (n = 5). Representative FACS plots (F) and frequency (G) of mTECs and cTECs in control mice (n = 4) and RPM-treated mice (n = 5). mTECs were defined as PTPRC− EPCAM+ UEA-1+ ENPEP− cells and cTECs as PTPRC− EPCAM+ UEA-1− ENPEP+ cells. (H) Absolute cell numbers of mTECs and cTECs in control mice (n = 4) and RPM-treated mice (n = 5). Representative FACS plots (I) and quantification (J) of mTECs from control mice (n = 4) and RPM-treated mice (n = 5) for the staining of MHC II, CD40, CD80 and AIRE. (K) Absolute cell numbers of MHC IIhigh, CD40+, CD80+ and AIRE+ mTECs isolated from control mice (n = 4) and RPM-treated mice (n = 5). FACS plots (L) and frequency (M) of mTECs with the phenotype of CD80+ AIRE+ from control mice (n = 4) and RPM-treated mice (n = 5). (N) Absolute cell numbers of CD80+ AIRE+ mTECs from control mice (n = 4) and RPM-treated mice (n = 4). **P<0.01 and ***P<0.001 compared with the control group.