
Figure 3.
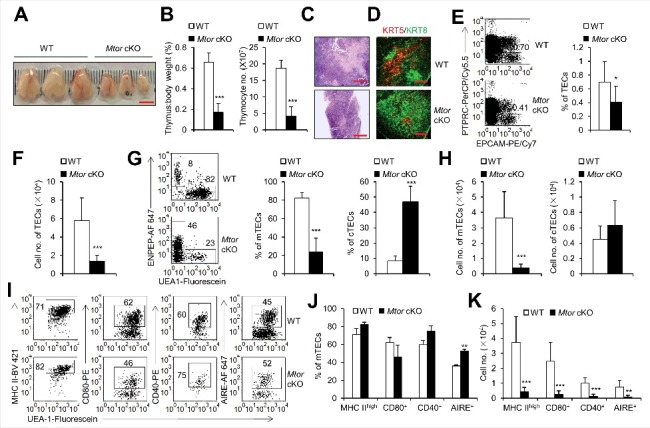
TEC-specific deletion of Mtor caused severe thymic atrophy. (A) Representative thymus pictures of 2-wk-old Mtor cKO and wild-type littermate control mice. Scale bar: 5 mm. (B) The ratio of thymus weight to body weight and total thymocyte numbers in 2-wk-old WT (n = 7) and Mtor cKO mice (n = 8). (C) H&E staining of the thymi from 2-wk-old WT and Mtor cKO mice is shown. Scale bars: 1000 μm. (D) Frozen thymic sections derived from 2-wk-old Mtor cKO mice and littermates for the expression of KRT5 (red) and KRT8 (green). Scale bars: 300 μm. (E) Flow cytometric profiles and frequency of TECs (PTPRC− EPCAM+) isolated from 2-wk-old Mtor cKO mice (n = 5) and WT littermates (n = 7). (F) Absolute cell numbers of TECs isolated from 2-wk-old Mtor cKO mice (n = 5) and littermates (n = 7). (G) Representative flow cytometry data and frequency of mTECs and cTECs from 2-wk-old WT (n = 14) and Mtor cKO mice (n = 11). (H) Absolute cell numbers of mTECs and cTECs from 2-wk-old WT (n = 14) and mutant mice (n = 11). (I) Flow cytometric staining of MHC II, AIRE, CD80 and CD40 within mTECs from 2-wk-old WT (n = 5) and Mtor cKO mice (n = 5). (J) Frequency of MHC IIhigh, CD80+, CD40+ and AIRE+ mTECs from 2-wk-old WT (n = 5) and Mtor cKO mice (n = 5). (K) Absolute cell numbers of MHC IIhigh, CD80+, CD40+ and AIRE+ mTECs from 2-wk-old WT (n = 5) and Mtor cKO mice (n = 5). *P<0.05, **P<0.01 and ***P<0.001 compared with control group.