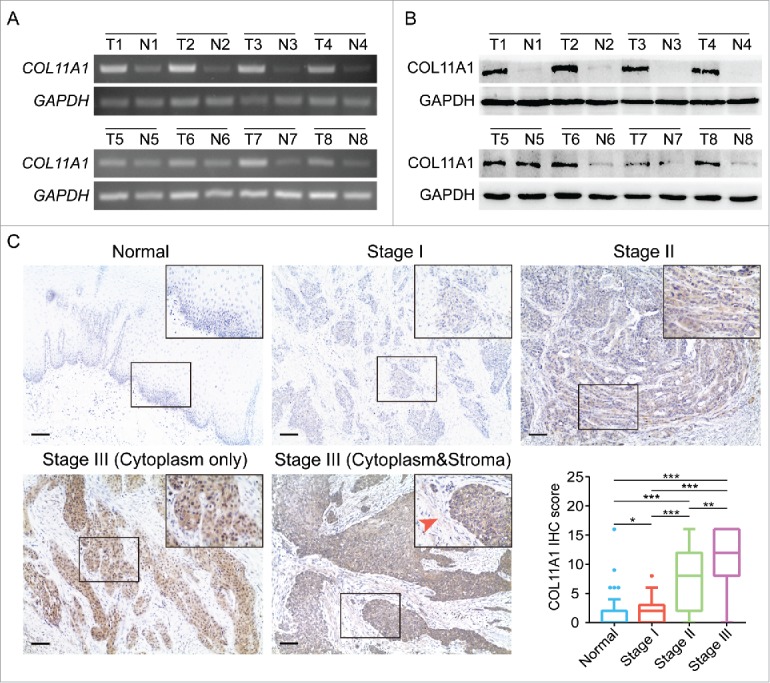
Figure 2.

Expression of COL11A1 in ESCC samples. (A) and (B) SqPCR and western blotting analysis of COL11A1 expression in 8 paired ESCC tissues and the corresponding normal epithelial tissues. (C) Representative images of COL11A1 staining in normal and tumor samples. Immunoreactive intensity increased as cancer progressed (arrow: faint stroma expression). Scale bar, 100μm. * p<0.05, ** p<0.01, *** p<0.001.
