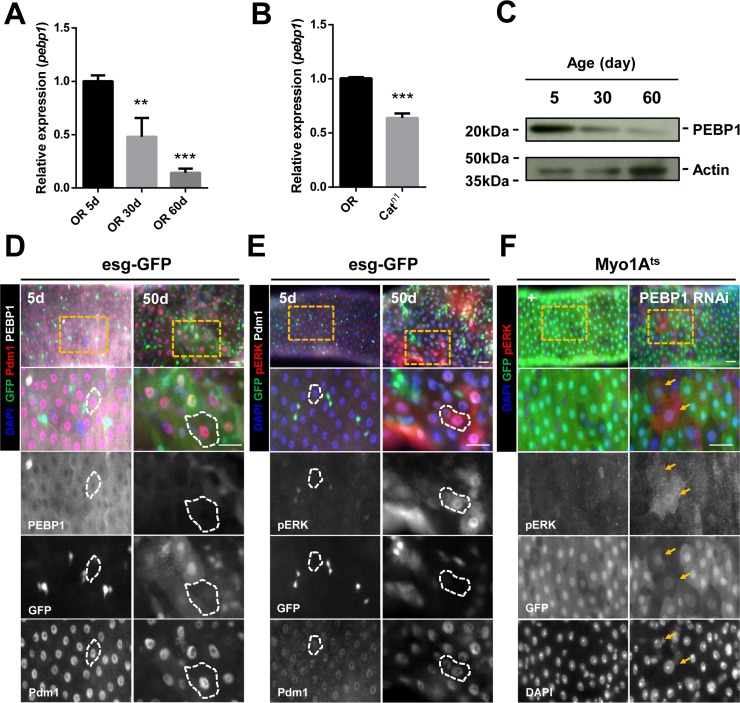
Figure 2. Decreased expression of PEBP1 is associated with increased ERK activity in ECs of aged midgut.
(A) RT-qPCR analysis shows that the expression level of pebp1 mRNA decreased in the guts of 30- and 60-day old flies as compared with the guts from 5-day-old flies. The expression levels of PEBP1 was determined using extracts from guts of 5-, 30- or 60-day-old flies. Means of four independent experiments ± SEM are shown. P values were calculated using a Student's t-test. ***p < 0.001, **p < 0.01 based on comparison to the 5-day-old flies. (B) RT-qPCR analysis shows that the expression level of pebp1 mRNA was reduced in the guts of catalase mutant (Catn1/+). The expression levels of PEBP1 were determined using extracts from the guts of 10-day-old OR and catalase mutant flies. Means of three independent experiments ± SEM are shown. P values were calculated using a Student's t-test. ***p < 0.001 based on comparison to the OR guts. (C) Western blot analysis shows that the protein level of PEBP1 decreased in the guts from 30- or 60-day-old flies as compared with those from 5-day-old flies. Actin is used as loading control. (D) PEBP1, which decreases in aged midguts, was observed in mature ECs (Pdm1+ and esg-GFP− cells, white dashed line) using esg-Gal4;UAS-GFP (esg-GFP) fly strains. Guts of 5- and 50-day-old esg-GFP strains were stained with anti-GFP (green), anti-Pdm1 (red), anti-PEBP1 (white), and DAPI. The four lower panels are enlarged images of the yellow dashed rectangle in the upper panel. d, day. Scale bar, 20 μm (E) Increased expression of pERK was identified in mature ECs (Pdm1+ and esg-GFP− cells, white line) of aged midgut. Guts of 5- and 50-day-old esg-GFP strains were stained with anti-GFP (green), anti-pERK (red), anti-Pdm1 (white), and DAPI (blue). The four lower panels are enlarged images of the yellow dashed rectangle in the upper panel. d, day. Scale bar, 20 μm. (F) ERK activity increased in ECs by EC-specific PEBP1 knockdown using Myo1Ats. After induction for 7 day at 29° C, guts of Myo1Ats>+ or Myo1Ats>PEBP1 RNAi flies were stained with anti-pERK (red), anti-GFP (green), and DAPI. The four lower panels are enlarged images of the yellow dashed rectangle in the upper panel. Yellow arrows indicate ECs showing increased ERK activity (Myo-GFP+ and pERK+). d, day. Scale bar, 20 μm.

