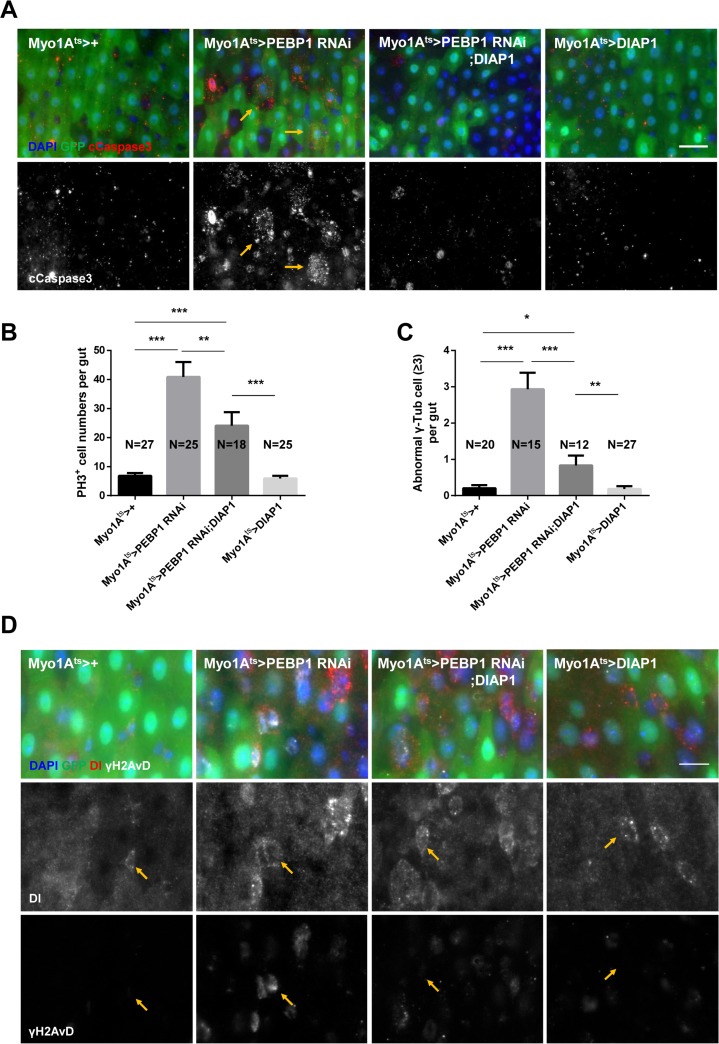
Figure 4. EC-specific knockdown of PEBP1 causes age-related phenotypes of ISCs via EC death.
(A) An increase in the number of cleaved caspase-3 in EC-specific PEBP1 knockdown guts was compensated by EC-specific DIAP1 overexpression. After induction for 7 days at 29° C, guts of Myo1Ats>+, Myo1Ats>PEBP1 RNAi, Myo1Ats>PEBP1 RNAi;DIAP1 or Myo1Ats>DIAP1 flies were stained with anti-GFP (green), anti-cleaved caspase-3 (cCapase3, red) and DAPI (blue). Scale bar, 20 μm. (B) The increased ISC mitotic index of EC-specific PEBP1 knockdown guts was compensated by EC-specific DIAP1 overexpression. After induction for 7 days at 29° C, guts were stained with anti-GFP (green), anti-PH3 (red) and DAPI (blue). The number of PH3+ cells was counted in whole guts of EC-specific PEBP1 knockdown flies. Data (mean ± SEM) were collated from 18–27 guts. N, number of counted guts. P values were calculated using a Student's t-test. ***p < 0.001, **p < 0.01 (C) The increase in the number of mitotic ISCs with supernumerary centrosome (≥3) in EC-specific PEBP1 knockdown guts was compensated by EC-specific DIAP1 overexpression. After induction for 7 days at 29° C, guts were stained with anti-GFP (green), anti-γ-Tubulin (γ-Tub, white), anti-PH3 (red) and DAPI (blue). Number of γ-Tubulin signal was counted in mitotic ISC of whole guts. Data (mean ± SEM) were collated from 12–27 guts. N, number of counted guts. P values were calculated using a Student's t-test. ***p < 0.001, **p < 0.01, *p < 0.05. (D) Increased γH2AvD accumulation of ISCs in EC-specific PEBP1 knockdown guts was compensated by EC-specific DIAP overexpression. After induction for 7 days at 29° C, guts were stained with anti-GFP (green), anti-Dl (red), anti-γH2AvD (white), and DAPI (blue). Yellow arrows indicate ISCs (Dl+ cells). Original magnification is 400×. Scale bar, 10 μm.

