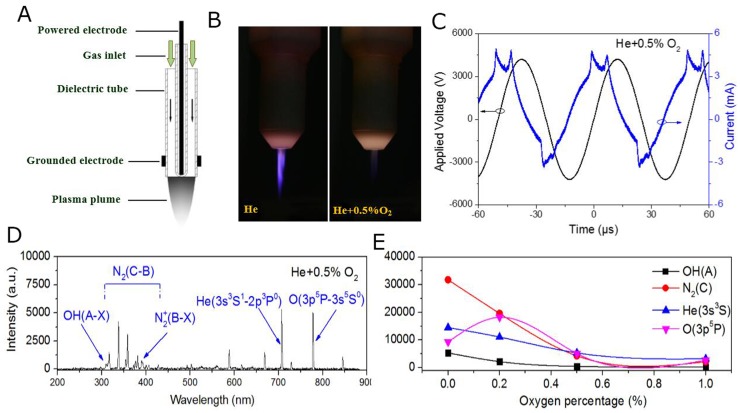
Figure 1. Characteristics of the plasma generation system.
(A) Schematic representation of the plasma jet. (B) Photographs of He plasma and He+O2 plasmas. (C) Monitoring of the applied voltage and current during He+O2 plasma generation. (D) Emission spectra of different He+O2 plasmas detected by the spectrometer. Some unique spectral lines (OH, N2, He and O) in the He+0.5% O2 plasmas are marked. (E) The intensity of several characteristic spectral lines are shown with varying O2 percentage in the working gas.

