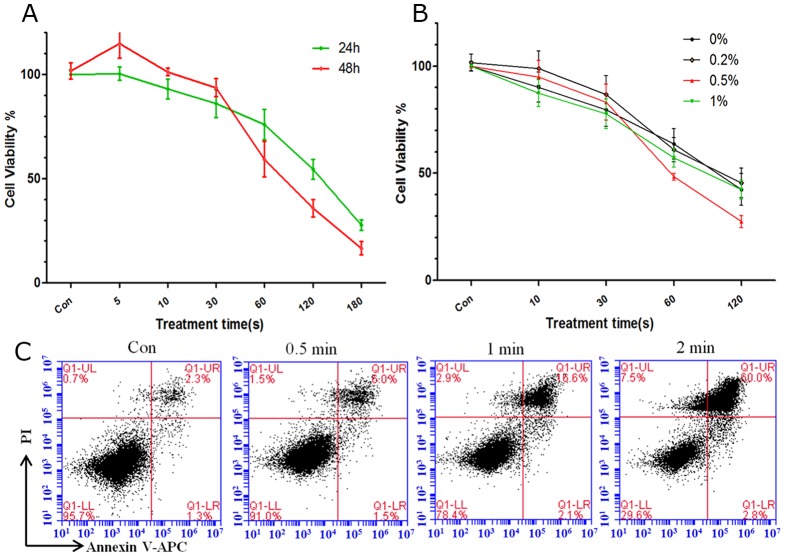
Figure 2. Cell viability and apoptosis after plasma treatment for different durations.
(A) Analysis of cell viability 24 h and 48 h after He plasma treatment for different durations. (B) Analysis of cell viability 24 h after He+O2 plasma for different durations. (C) Cell apoptosis analyzed by flow cytometry after He+0.5%O2 plasma treatment for 0.5, 1, and 2 min.

