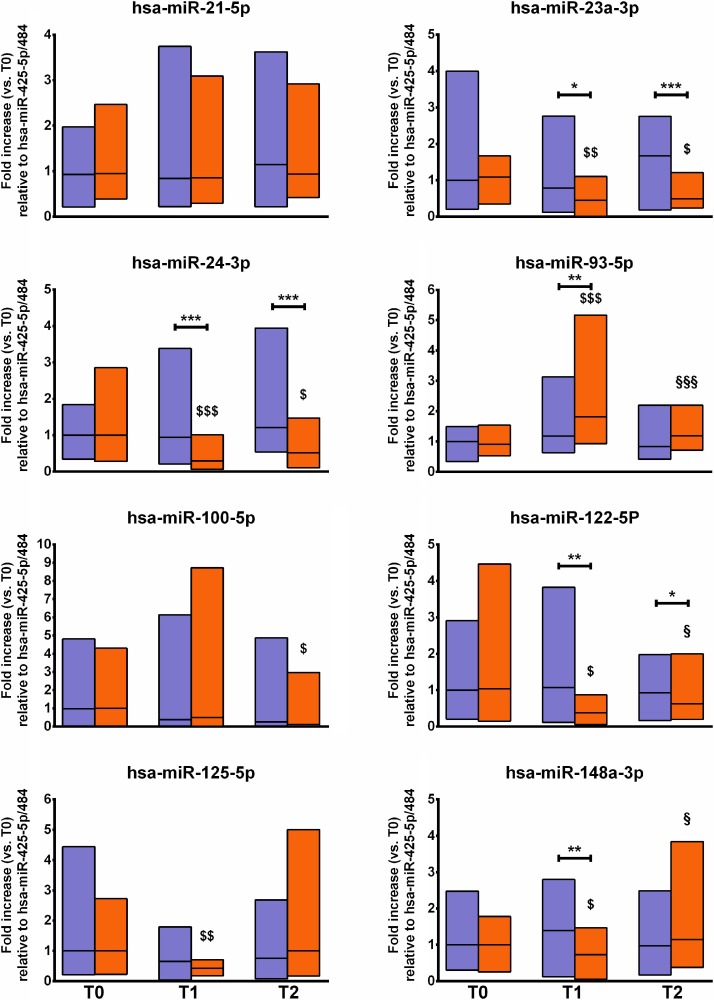
Figure 1. Changes in fracture risk-associated circulating miRNAs.
The figure shows the changes in the profile of circulating miRNA associated with fracture risk before (T0), during (T1), and after (T2) an 8-week repeated-sprints training protocol in the experimental group (orange blocks) and the controls (violet blocks). The relative expression of target miRNA is normalized to miR-425-5p and miR-484, here considered as housekeeping. The mean T0 values of the CTRL group were set at 1. Blocks indicate the ranges, central lines indicate the mean values. Asterisks indicate significant intergroup differences at a specific time point (*p < 0.05; **p < 0.01; ***p < 0.001). Symbols on bars indicate within-group difference vs. T0 ($p < 0.05; $$p < 0.01; $$$p < 0.001) and vs. T1 (§p < 0.05; §§p < 0.01; §§§p < 0.001).

