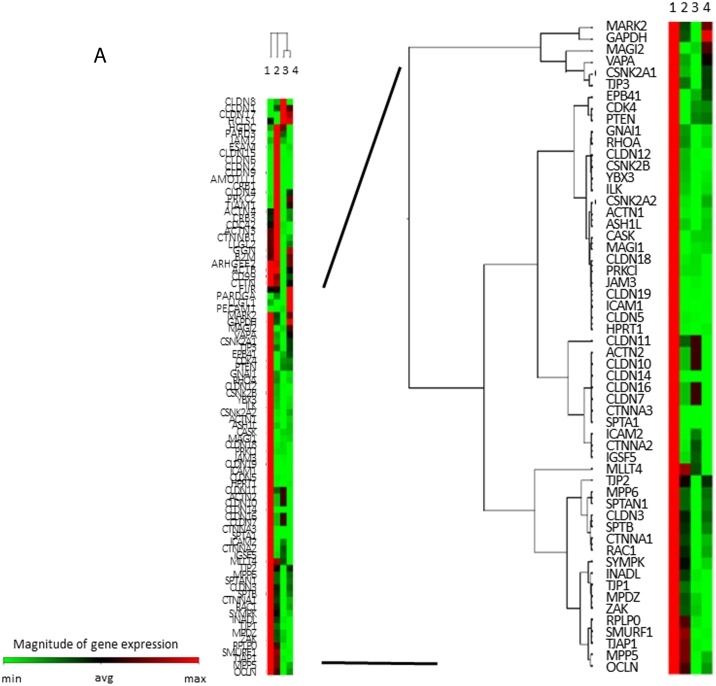
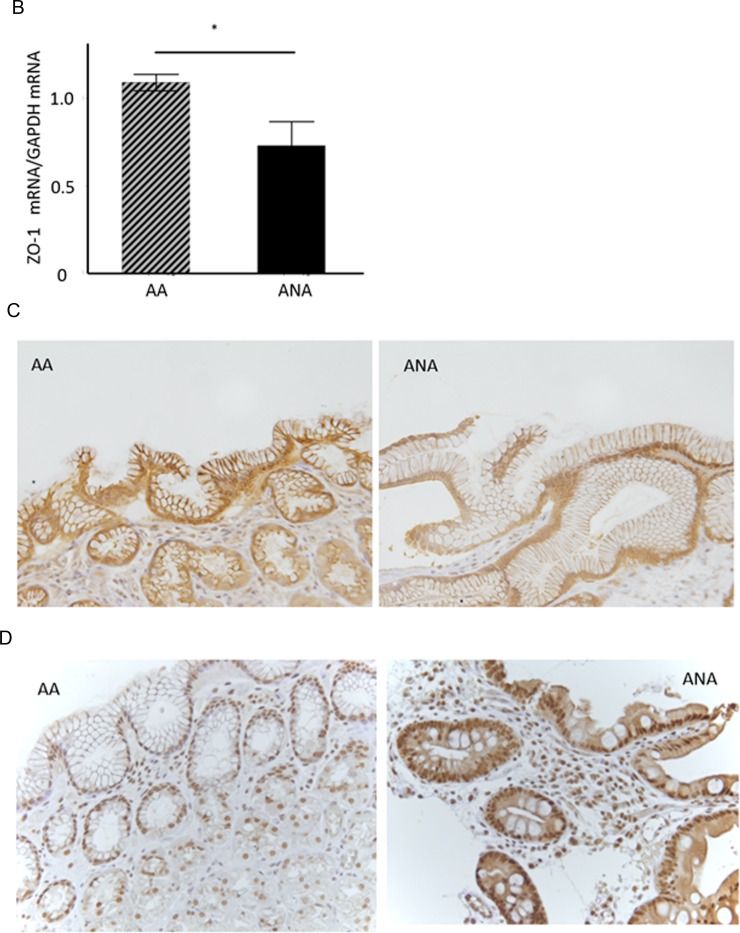
Figure 2. TJ-gene expressions in ANA and AA.
(A) In a comprehensive analysis of the expressions of TJ-genes as a discovery phase, frozen-stocked specimens from post-eradication mucosa (1. AA, 2. ANA) and H. pylori-infected mucosa (3. AA, 4. ANA) were studied using a human tight junction genes RT2 PCR array analysis (N = 3–5). (B) In the validation phase, the expression of ZO-1 mRNA in ANA was significantly diminished compared to that in AA (N = 18, *P = 0.008, Student`s t-test). (C, D) A representative image of an immunohistochemical study for ZO-1 and snail (×400). The expression of ZO-1 in ANA (C: right) was decreased in comparison to that in AA (C: left), although that of snail in ANA (D: right) was increased in comparison to that in AA (D: left).


