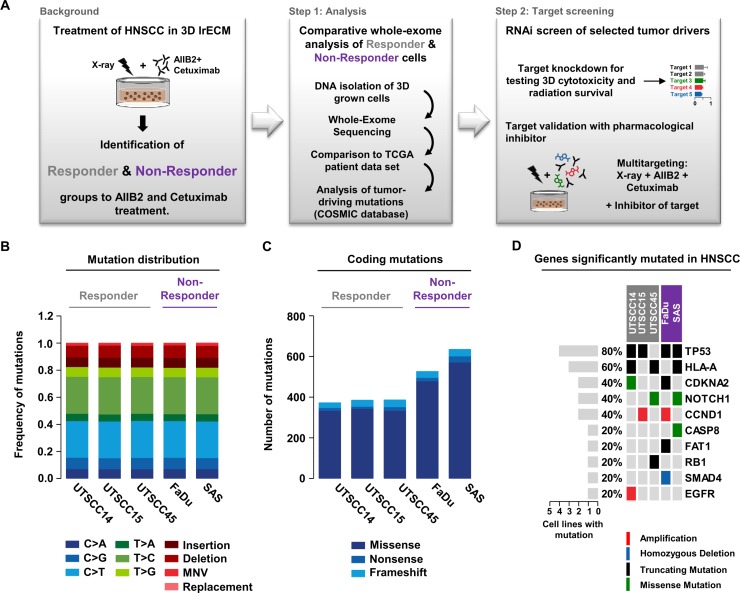
Figure 1. Comparative whole exome sequencing analysis of responder and non-responder HNSCC cells.
(A) Background and workflow of experimental setups. (B) Distribution of single-nucleotide variants, insertions, deletions, multi-nucleotide variants (MNV) and replacements detected in the tested responder (grey) and non-responder (purple) 3D grown HNSCC cell lines. (C) Distribution of coding mutations (missense, nonsense and frameshift mutations) measured in tested HNSCC cell lines. (D) Matrix of genes most frequently mutated in HNSCC patients and their mutation appearance in 3D lrECM grown responder (grey) and non-responder (purple) cell lines.

