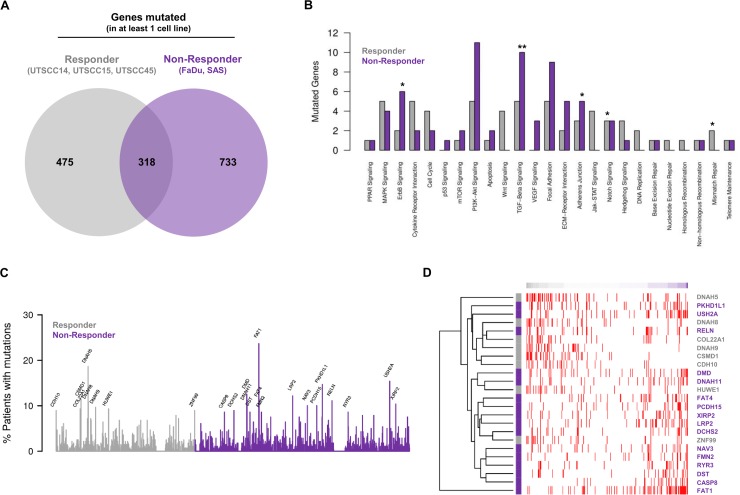
Figure 2. Mutational profiles of responder and non-responder cells allow stratification of HNSCC patients.
(A) Venn diagram analysis of recurrently mutated genes (found to be mutated in at least one out of five cell lines) showing shared and exclusively mutated genes in the responder or non-responder groups. (B) Analysis of cancer associated signaling pathways affected by exclusively mutated genes found for responder and non-responder cell lines. Numbers of mutated genes in each known cancer-relevant signaling pathway are shown. Significant enrichment of mutated genes in a pathway of a group is highlighted by * for P < 0.1 and by ** for P < 0.05 (Fisher's exact test). (C) Analysis of mutation frequencies of exclusively mutated genes found for responder and non-responder cell lines within the HNSCC cohort of the TCGA. Only names of genes mutated in at least 8% of the patients are shown. (D) Exclusively mutated genes found for responder and non-responder cell lines allow determination of the similarity of TCGA HNSCC patients with potential responder and non-responder profiles. Patient-specific gene mutation profiles were compared with the corresponding characteristic profile of the responder and non-responder cells considering genes mutated in at least 8% of the TCGA HNSCC cohort (C). Heatmap shows individual mutation profiles of patients (columns) for the selected genes (rows). Gene mutations are highlighted in red in the heatmap. Patients are sorted according to the similarity of their gene mutation profiles from potential responder (left) to non-responder profiles (right). Colors of the gene names on the right side of the heatmap represent their exclusive presence in either responder (grey) or non-responder cell lines (purple).

