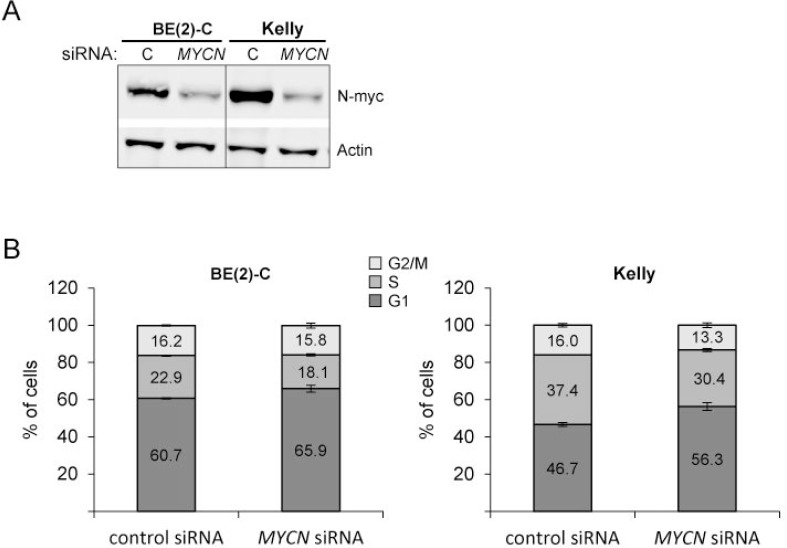
Figure 10. MYCN knockdown increases the number of cells in G1.
Cells were transfected with control siRNA or MYCN siRNA. 24 hours after transfection, cells were harvested for Western blot analysis to show N-Myc knockdown (A) or cells were fixed with ethanol and cell-cycle profiles were determined by propidium iodide incorporation and flow cytometry analysis (B). Results from cell cycle analysis are presented as percentage of cells in a particular phase. Cell cycle data are mean ± SD of one representative experiment of at least two, each performed in triplicate. Western blot data show one representative experiment. Actin was used to demonstrate equal protein loading.

